What Is Bollinger Bands Indicator in Trading and How to Use It?
2023-04-06 10:37:30
Brief Intro to the Bollinger Bands Indicator
The Bollinger Bands indicator is a widely employed technical analysis tool that is named after its inventor, John Bollinger, who first conceived it in the 1980s.
It consists of upper and lower bands on the price chart that adjust to crypto price volatility, allowing for more precise identification of squeeze and breakout patterns. This reflects a more accurate signal of price movements and uncertainty in the crypto market.
What Is the Bollinger Bands Indicator?
The Bollinger Bands indicator consists of an upper Bollinger band, a lower Bollinger band, and a middle moving average line (also known as the middle band). This indicator not only excels in identifying the fluctuation range and trend of cryptos but also measures whether the price is overbought or oversold.
In general, when the price goes above the upper band, it indicates an overbought condition which may have a correction or pullback. If the price falls below the lower band, it implies an oversold condition that may rebound or reverse.
What Is the Formula to Calculate the Bollinger Bands Indicator?
1. Calculate the middle band.
Middle band = Simple Moving Average (SMA) of the closing prices over n periods
2. Calculate the upper band.
Upper band = Middle band + (n-period standard deviation x K)
3. Calculate the lower band.
Lower band = Middle band - (n-period standard deviation x K)
Note: n is a parameter, taken as 20 days. The value of K is typically set to 2.
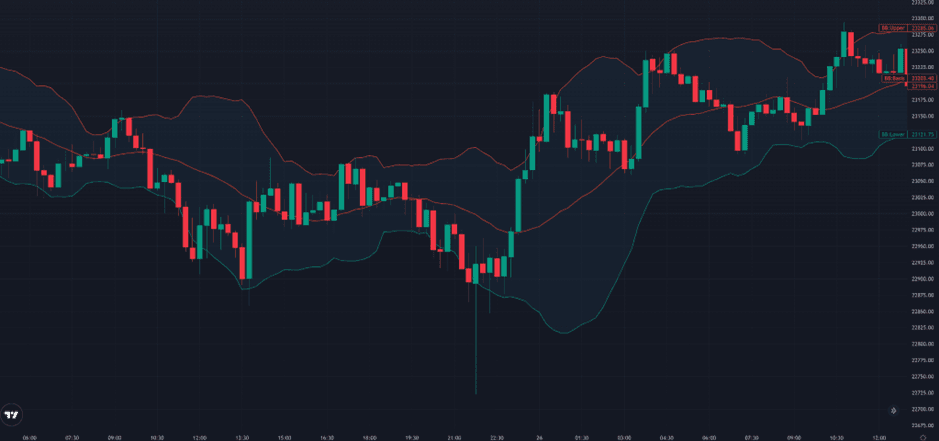
As shown in the chart below, orange, red, and green lines refer to the middle band, upper band, and lower band, respectively.
What Are the Principles and Features of the Bollinger Bands Indicator and How to Use it to Identify Market Trends?
The Bollinger Bands indicator is calculated by the middle band (SMA) ± standard deviation, so it is important to understand the concept of the standard deviation before using the indicator. The standard deviation is closely related to market volatility, that is, it can be interpreted as a measurement unit of price volatility, representing how volatile and uncertain the price is. The larger the standard deviation value, the greater the price fluctuation, as well as the further the distance between the upper and lower bands. In contrast, a smaller value corresponds to lower volatility and a closer distance between the upper and lower bands.
Therefore, a volatile market refers to a high standard deviation value of the Bollinger Bands indicator, while a stable market indicates a low standard deviation value correspondingly.
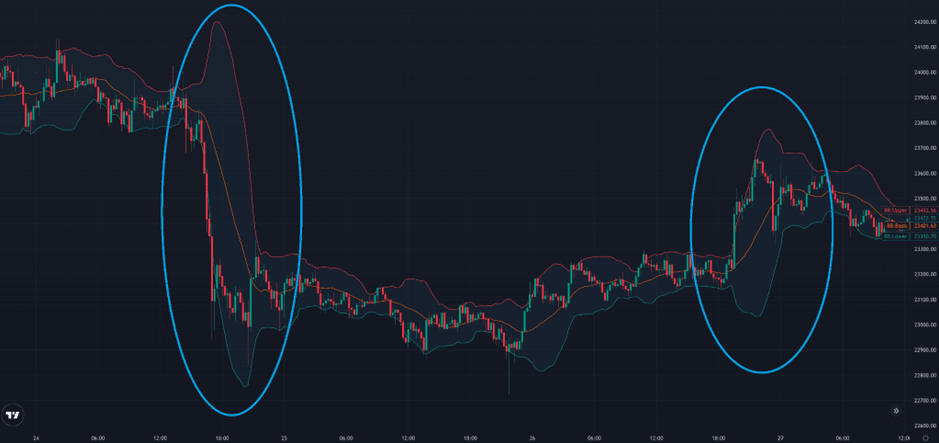
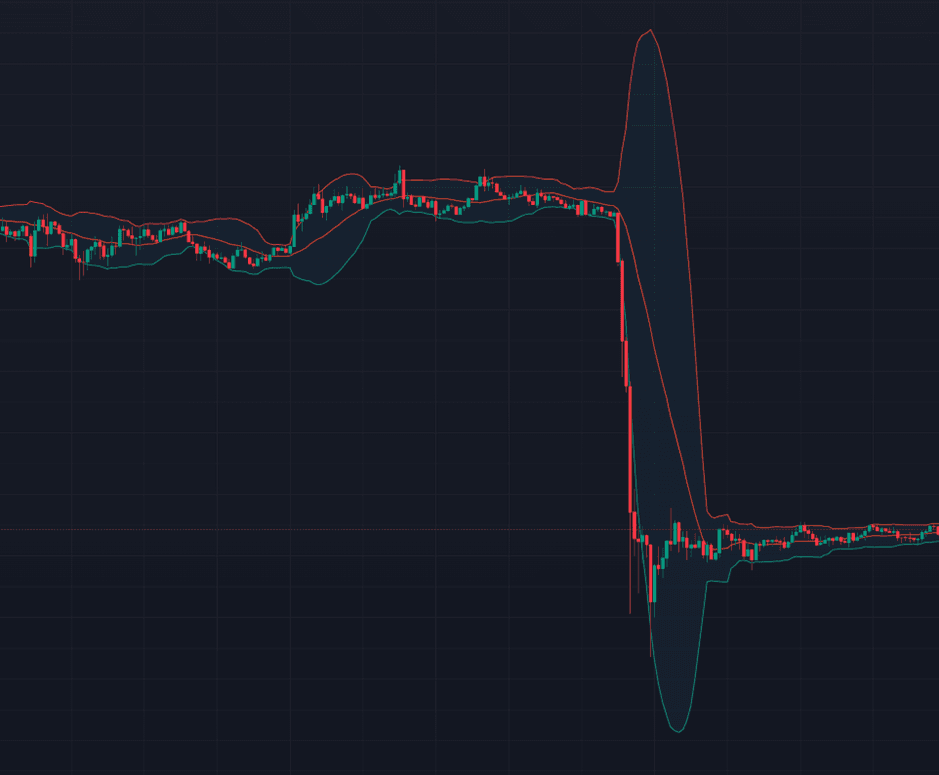
As shown in the blue circle below, a sharp rise in price volatility accompanies an increase in the standard deviation value. As a result, the two sidelong bands expand significantly.
The standard deviation value can be used to determine market volatility. When the upper band is away from the lower band, representing a larger standard deviation value, the market is greatly volatile so investors should take risk management measures accordingly, such as reducing positions or setting stop losses. On the contrary, If the two sidelong bands contract, indicating a smaller standard deviation value, the market volatility is low, and investors can consider increasing positions or expanding the trading range to obtain more profits. In general, the standard deviation value in the Bollinger Bands indicator, a key element to measure market volatility, can help investors develop reasonable investment strategies.
Features of the Bollinger Bands Indicator:
- 1. The price volatility is relevant to the width between the upper and lower bands: High price volatility leads to a wider gap between the upper and lower bands, while low price volatility can narrow the distance between two sidelong bands. Thus, the upper-lower width can be used to measure the change in market volatility over a certain period.
- 2. The price trend affects the position of the Bollinger Bands indicator: A clear price trend results in the two sidelong bands moving in the direction of the trend. For instance, if the price rises, the middle band, along with the upper and lower bands, will move upward. Conversely, if the price drops, the middle band will move downward, and so do the two sidelong bands.
- 3. The upper and lower bands reflect the uncertainty of price fluctuations: An abnormal price fluctuation results in a squeeze or breakout pattern. This usually means that the price fluctuation is more uncertain, so investors need to pay special attention and take appropriate measures, such as modifying profit and loss limits.
- 4. The Bollinger Bands indicator can manifest market oscillations: When the price fluctuates between the upper and lower bands, it indicates that the market is in a consolidation oscillation. In this case, investors can adopt appropriate position management and trading strategies, such as reducing positions or increasing trading frequency properly.
- 5.Wide range of applications: The Bollinger Bands indicator can be applied to different markets, including cryptocurrencies, stocks, futures, forex, etc.
Common Bollinger Bands Patterns
It is possible to discern the price trend, as well as overbought and oversold conditions, by analyzing the asset price in conjunction with the relative positions of the Bollinger Bands indicator.
Indcator’s Trend Proportional to the Price
It's common for prices to jump or drop in response to an upward or downward Bollinger Bands indicator, respectively, which indicates that the market is more likely to continue moving in its original direction.
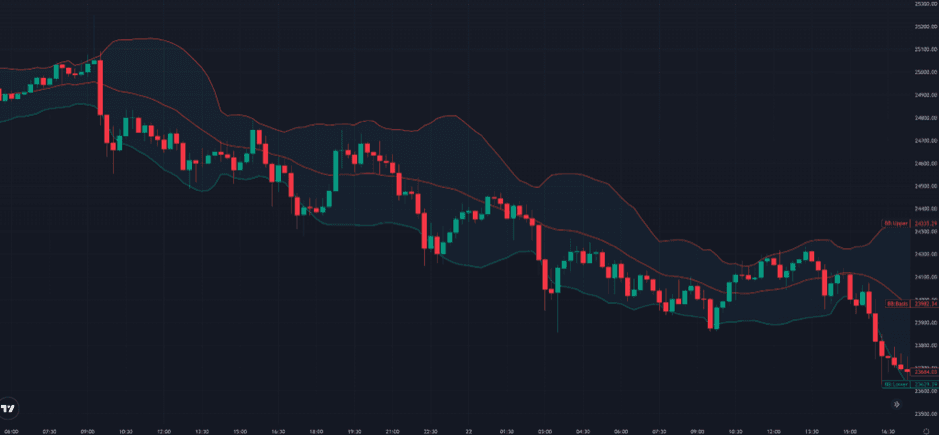
The chart below shows a downtrend in price accompanied by a falling Bollinger Bands indicator.
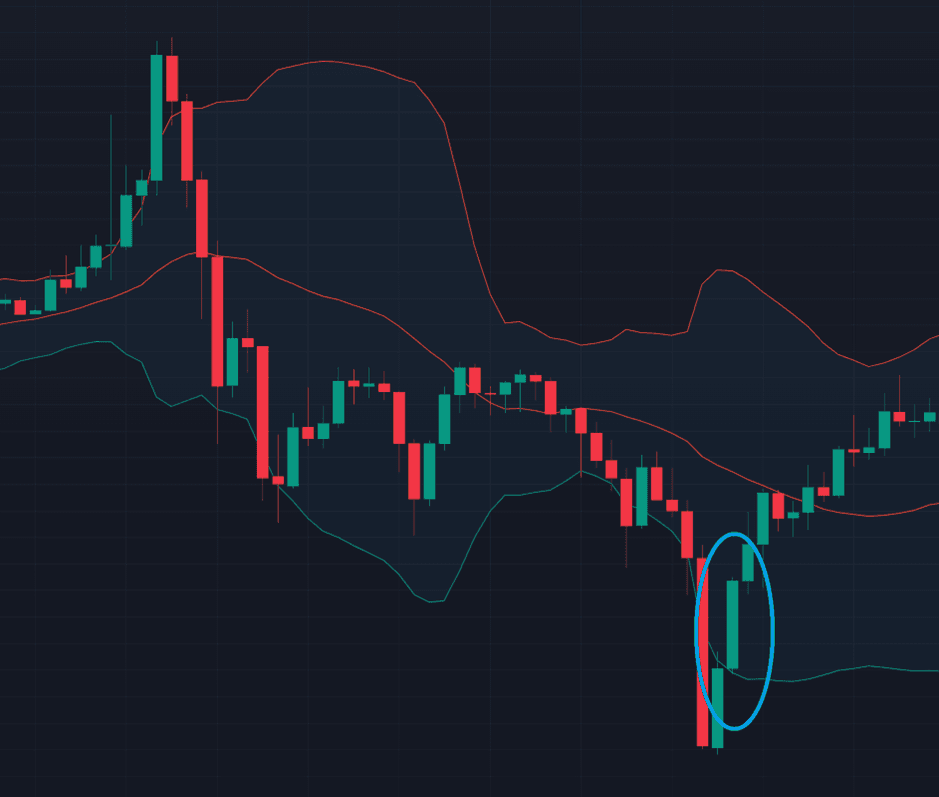
Buying the Dip via the Bollinger Bands Indicator in Downtrend
Generally speaking, when a price is below the lower band, it represents the price entering an oversold condition, implying a high chance of a reversal and upward trend later. It's important to note that hastily buying in during a downtrend is more likely to result in a counterattack, especially during a major trend where the market is expected to follow the trend's development for a certain period of time. Therefore, it is recommended to observe the asset when the price crosses below the lower band and buy the dip as the price goes above it.
How to Use the Bollinger Bands Indicator?
The upper and lower bands can be used to identify whether the asset is overpriced or underpriced. Meanwhile, the middle band refers to determining the trend of the market. The Bollinger Bands indicator can be applied as follows:
- 1. Determine the market trend: If the price swings between the upper and lower bands, indicating that the market is undergoing volatility, trend trading strategies may not be viable. When the price breaks through the upper band, implying an upward market, it is recommended to buy in or go long as appropriate. Conversely, as the price falls below the lower band, which indicates that the market is in a downtrend, a sell-out or go-short strategy is favorable.
- 2. Identify oversold and overbought points: Oversold and overbought points can be obtained via the relative positions of the upper band, lower band, and price. If the price continuously falls below the lower band with a large standard deviation value, the market has been oversold. In this case, it is recommended to buy in or go long when appropriate. In contrast, when the price steadily goes above the upper band accompanied by a high standard deviation value, the market has been overbought, and it is advisable to sell out or go short as needed.
- 3. Determine the strength of the market trend: The width and slope of the Bollinger Bands indicator can be used to judge the strength of the market trend. With a steep slope and a far distance between the two sidelong bands, the market trend becomes strong. On the contrary, when the upper band is close to the lower band with a mild slope, it indicates that the market trend turns weak.
Can the Bollinger Bands Indicator Work with Others?
The Bollinger Bands indicator can work with other tools, such as the Relative Strength Index (RSI) indicator, the Moving Average Convergence Divergence (MACD) indicator, candlestick patterns, and other technical indicators. Moreover, the market trend and volatility can be better identified using the Bollinger Bands indicator and others, improving trade accuracy and reliability.
Conclusion
The Bollinger Bands indicator is one of the few technical indicators that can simultaneously identify the market trend, overbought and oversold conditions, and volatility. This indicator can be used for developing trend or counter-trend trading strategies, which can effectively help investors grasp the price dynamics. When further combined with others for comprehensive identification, the Bollinger Bands indicator can play a better role in helping investors create more suitable trading strategies.
FAQ
Q: How to Use the Bollinger Bands Indicator in a Trading Strategy?
A: When the price consistently falls below the lower band, and the standard deviation value is high, it suggests that the market is oversold, indicating a potential buying opportunity. However, if the price rises above the upper band while exhibiting a high standard deviation, it suggests that the market may be overbought, and selling out or reducing positions is recommended.
This is not investment advice. Please conduct your own research when investing in any project.