What Is DMI Indicator in Trading and How to Use It?
2023-05-04 04:19:25
Preface: Brief Intro to the DMI Indicator
The Directional Movement Index (DMI) indicator was developed by J. Welles Wilder, a well-known American technical analyst who also invented the Relative Strength Index (RSI) indicator. The DMI indicator is for technical analysis with a value between 0 and 100, used to evaluate price trends and directions.
What Is the DMI Indicator?
The DMI indicator is used to identify trend strength and direction to find when to trade. It determines trend strength and direction by calculating the current high and current low, as well as by identifying the direction of price changes. The indicator can independently identify the strength and momentum of both longs and shorts, making it relatively rare among technical analysis indicators. The indicator consists of three lines: a positive directional movement line (+DI) and a negative directional movement line (-DI), as well as an optional third line, called the average directional index (ADX).
What Is the Formula to Calculate the DMI Indicator?
The DMI indicator can be used to assess whether the market trend is clear. The formula is as follows:
- 1. Calculate values of +DM and -DM before measuring +DI and -DI. The following formula describes how to calculate +DM and -DM subject to certain conditions:
- a. +DM: Current high - Previous high
- b. -DM: Previous low - Current low
- c. Additional calculations:
- i. If +DM is less than 0, +DM is 0.
- ii. If -DM is less than 0, -DM is 0.
- iii. If +DM is greater than -DM, -DM equals 0.
- iv. If -DM is greater than +DM, +DM equals 0.
- 2. Calculate a true range (TR):
- a. A: Current high - Previous close
- b. B: Previous close - Current low
- c. C: Current high - Current low
- d. The TR value takes the maximum among A, B, and C above.
- 3. Calculate +DI:
+DI = (The sum of +DM for N periods / The sum of TR for N periods) × 100
- 4. Calculate -DI:
-DI = (The sum of -DM for N periods / The sum of TR for N periods) × 100
- 5. Calculate ADX:
- a. DX = [(+DI - -DI) / (+DI + -DI)] × 100
- b. ADX = The sum of DX / N periods
N is typically taken as 14. Despite the complex DMI calculation, the DMI indicator is easy to use.
As shown in the following figure, lines in green, red, and blue refer to +DI, -DI, and ADX, respectively.
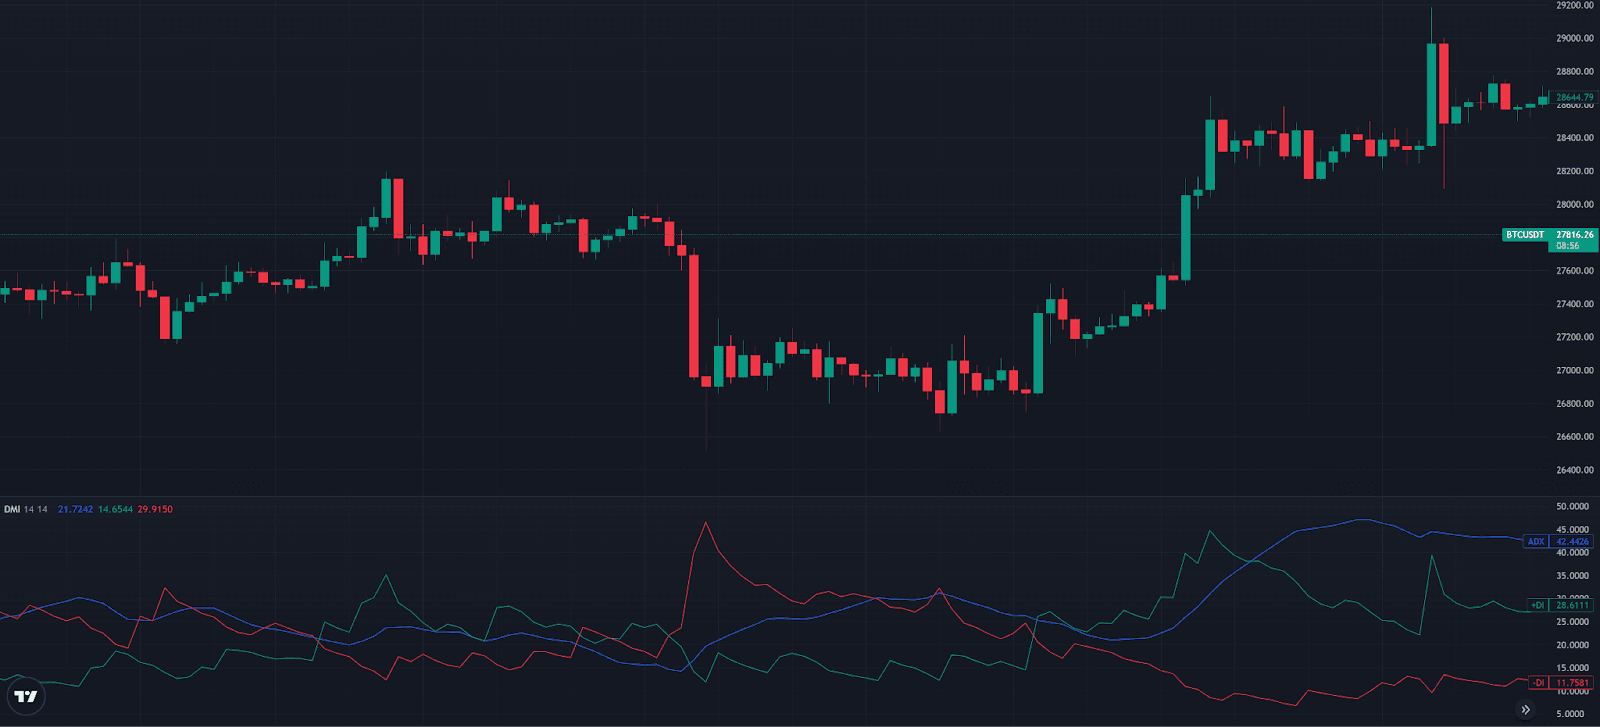
DMI Principles
The DMI indicator is composed of three lines, two of which determine the strength of the bullish and bearish directions: +DI and -DI. +DI is used to evaluate an upward trend of the market, while -DI is used to assess a market downtrend. Additionally, ADX focuses on analyzing the trend strength. When an ADX value is high, it indicates that the market trend is strong, while a low ADX value suggests a weak market trend.
The DMI indicator can distinguish between trending and non-trending markets through ADX, and divide trends into long and short markets through +DI and -DI.
DMI Common Patterns
The DMI indicator, composed of three lines, fluctuates between 0 and 100. +DI and -DI are used to determine the strength of the bulls and bears, respectively. ADX is used to measure the strength of market trends. Typically, 25 is taken as an assessment benchmark for ADX, and the relative positions of +DI and -DI are used to determine directions.
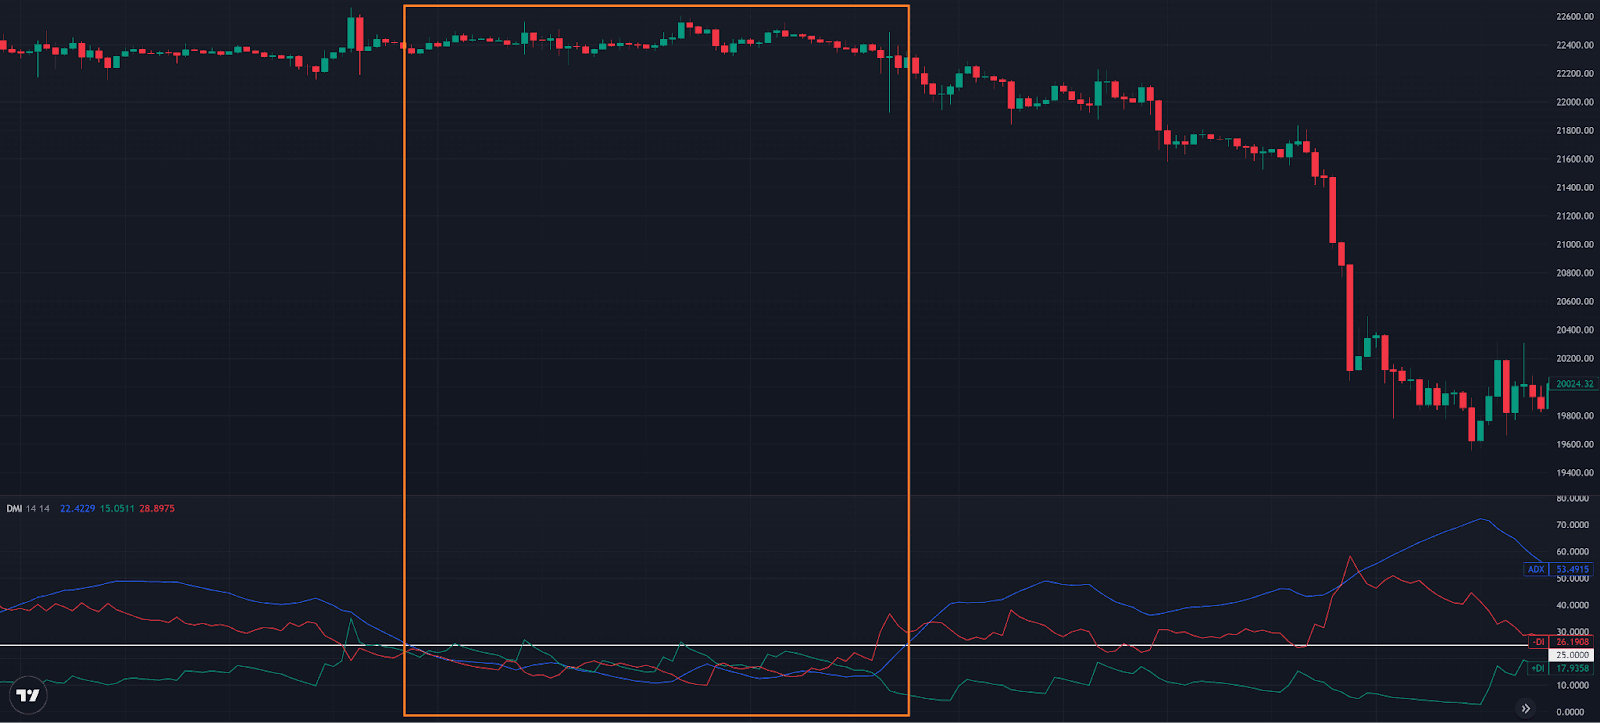
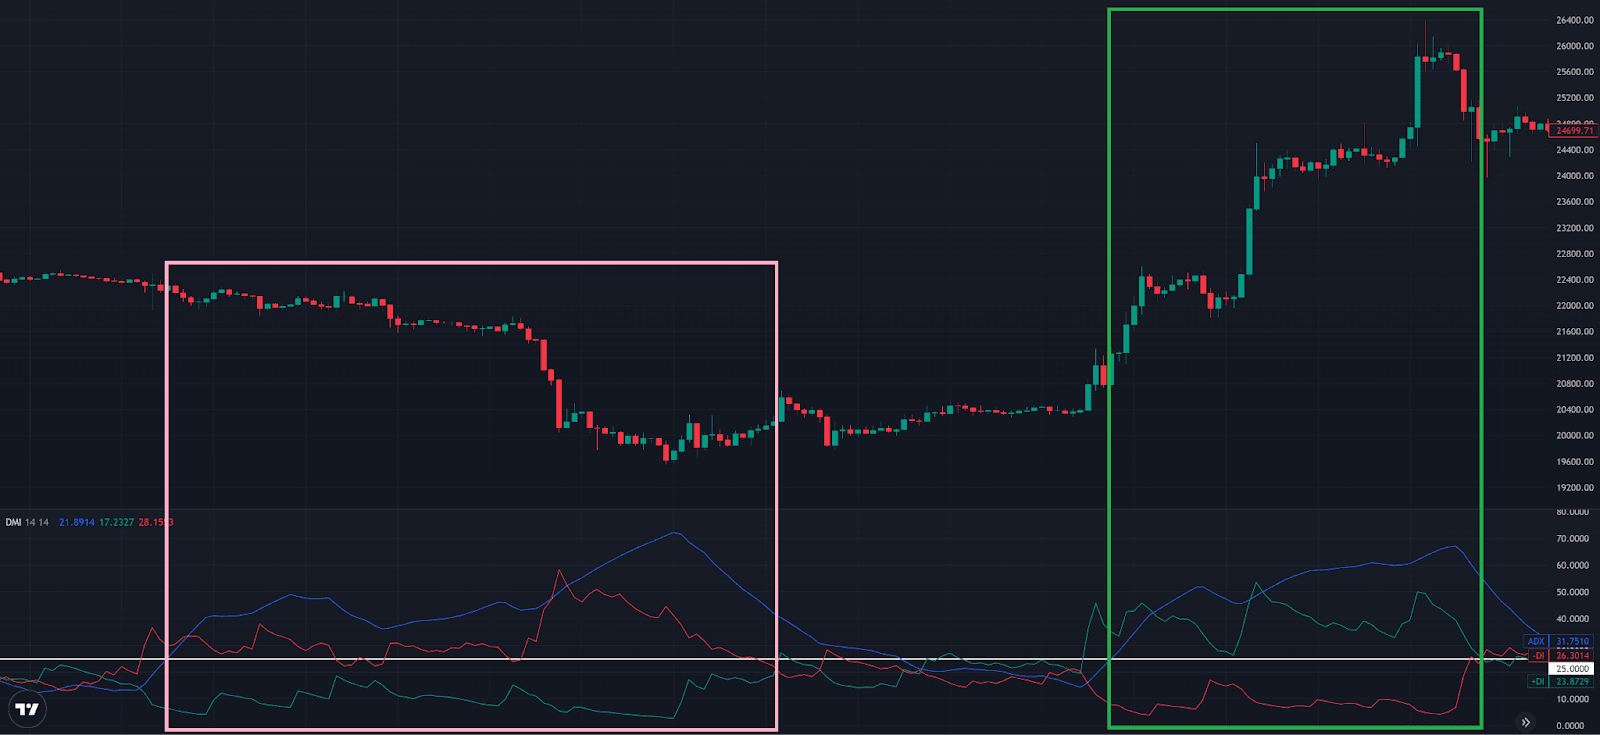
ADX <25 Refers to a Non-Trending Market
ADX can be used to determine whether the market has a clear trend. When an ADX value is less than 25, it indicates that the market is in a sideways consolidation phase without a clear trend. At this time, short-term contrarian strategies can be adopted, or it may be wise to hold off on trading until a clear trend emerges.
ADX >25 Refers to a Trending Market
An ADX value greater than 25 manifests a trending market instead of a consolidation phase. In addition, +DI and -DI can be used to identify the subsequent trend direction for a more complete analysis.
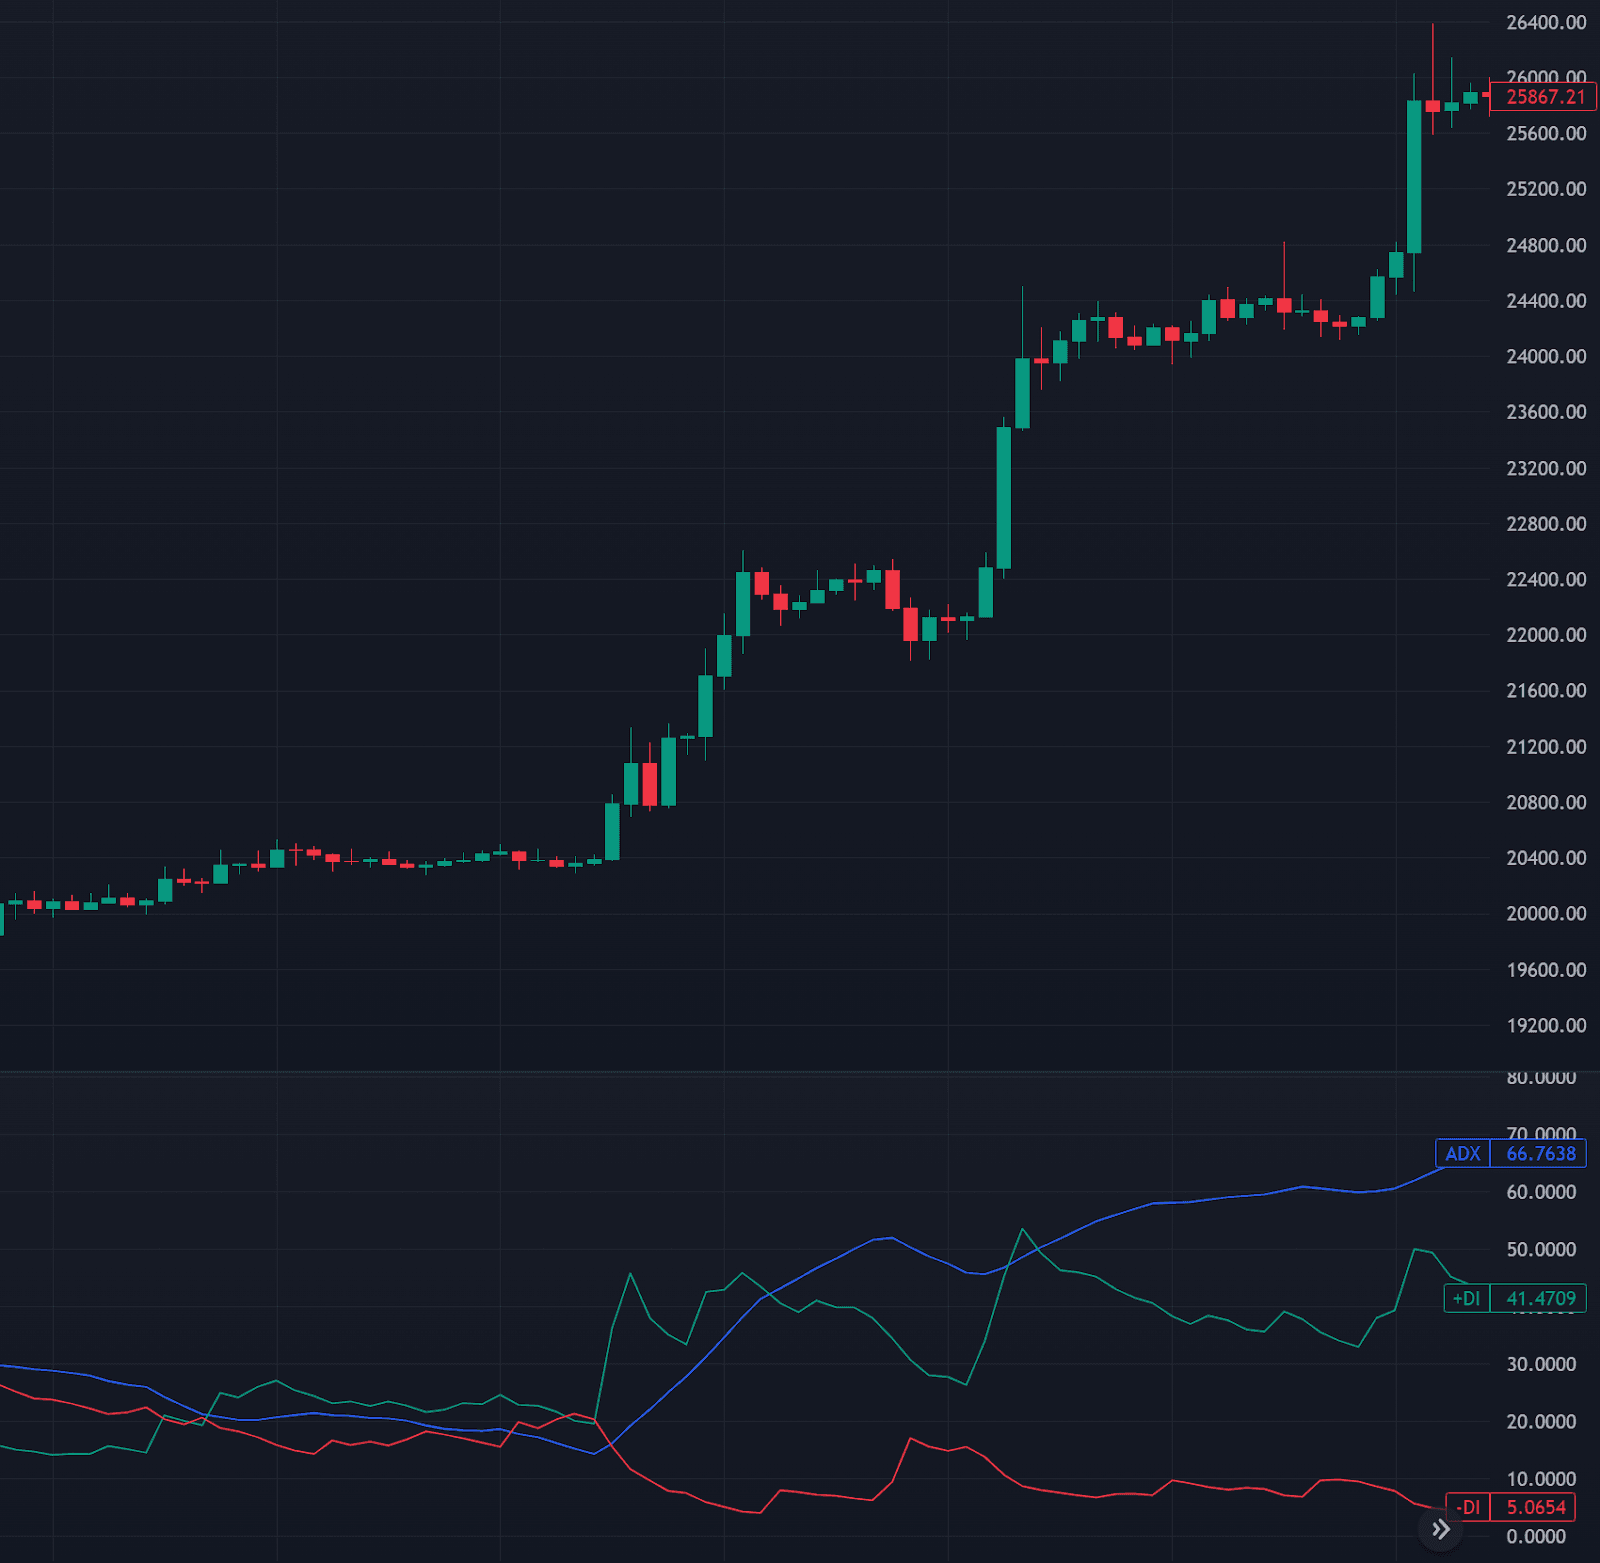
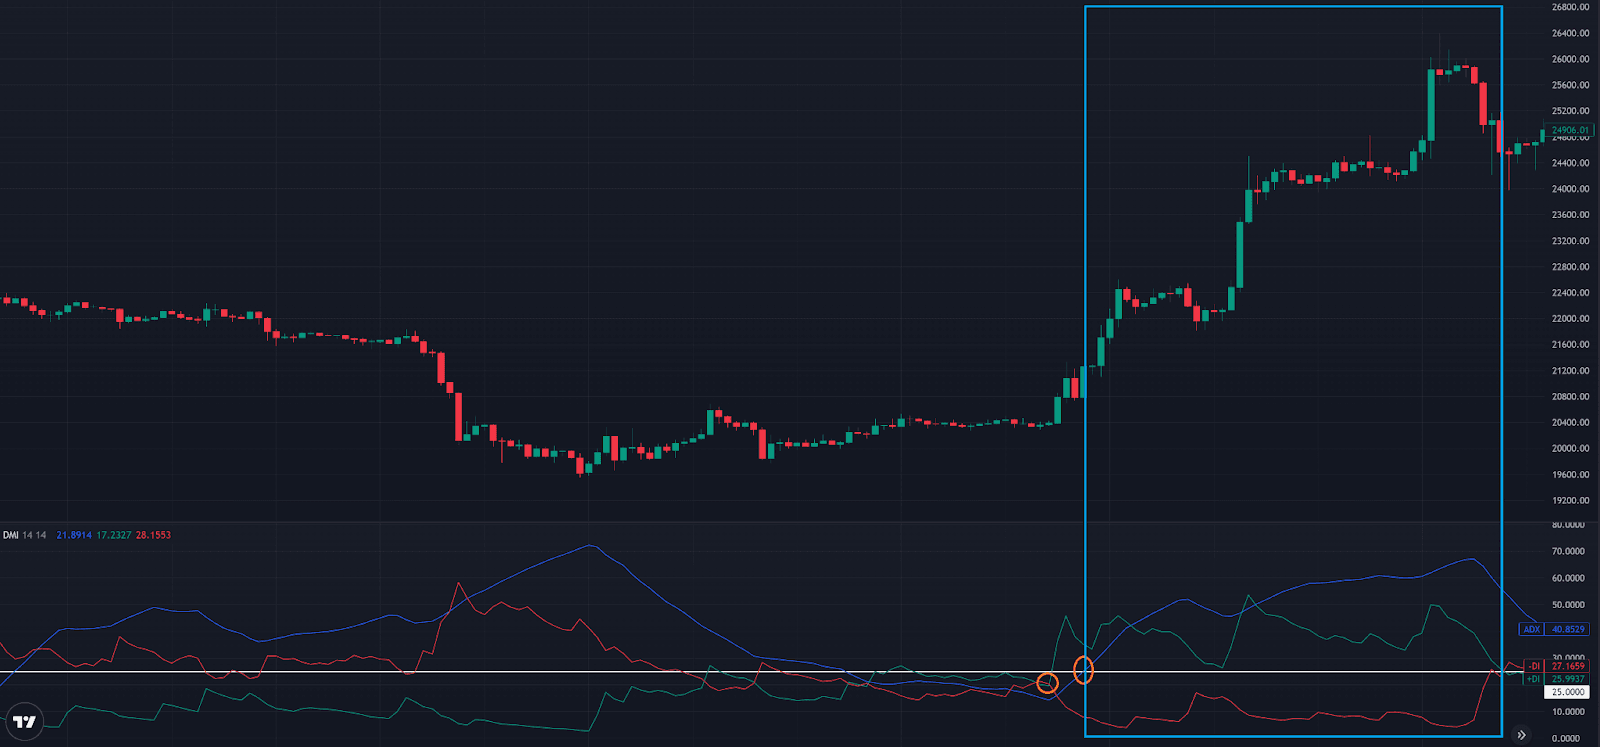
+DI > -DI Refers to a Trending Long Market
When +DI crosses above -DI, it is called a golden cross between +DI and -DI, with +DI higher than -DI. This represents a bullish trend in the market, and if ADX is also greater than 25, it officially enters a trending long market, and upward momentum is more likely to continue.
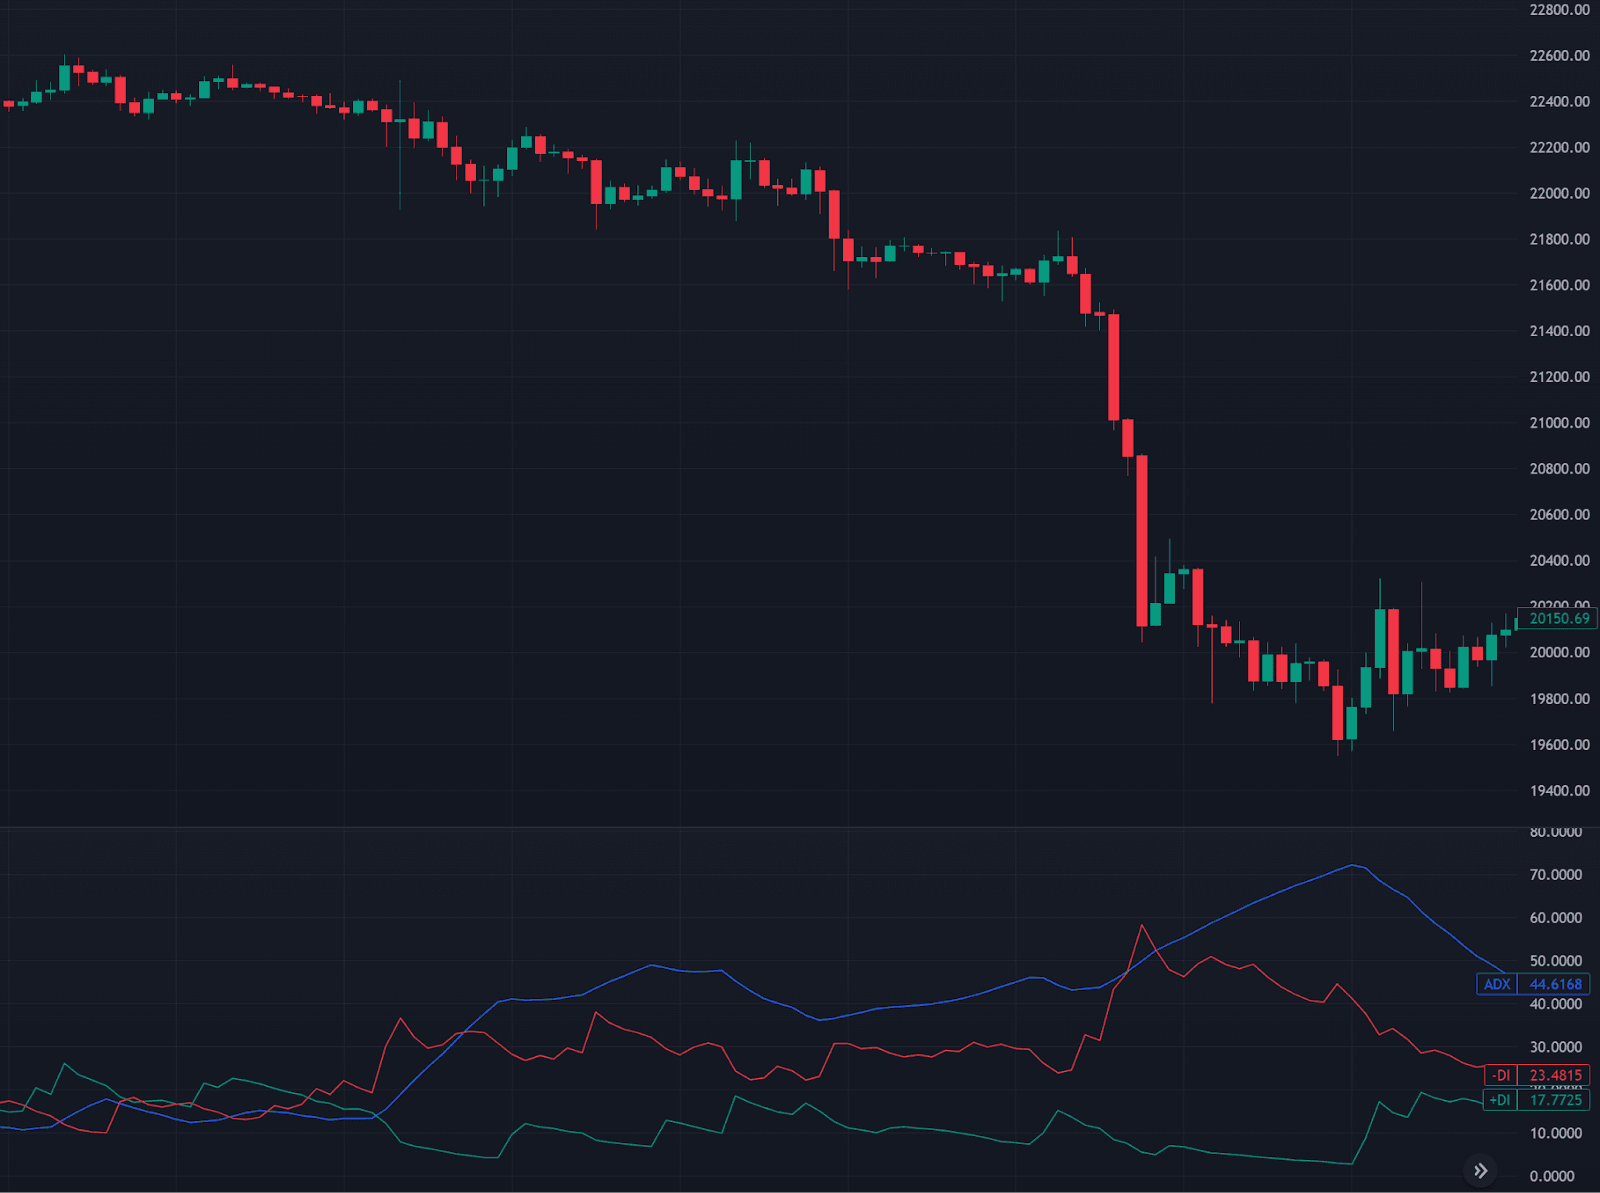
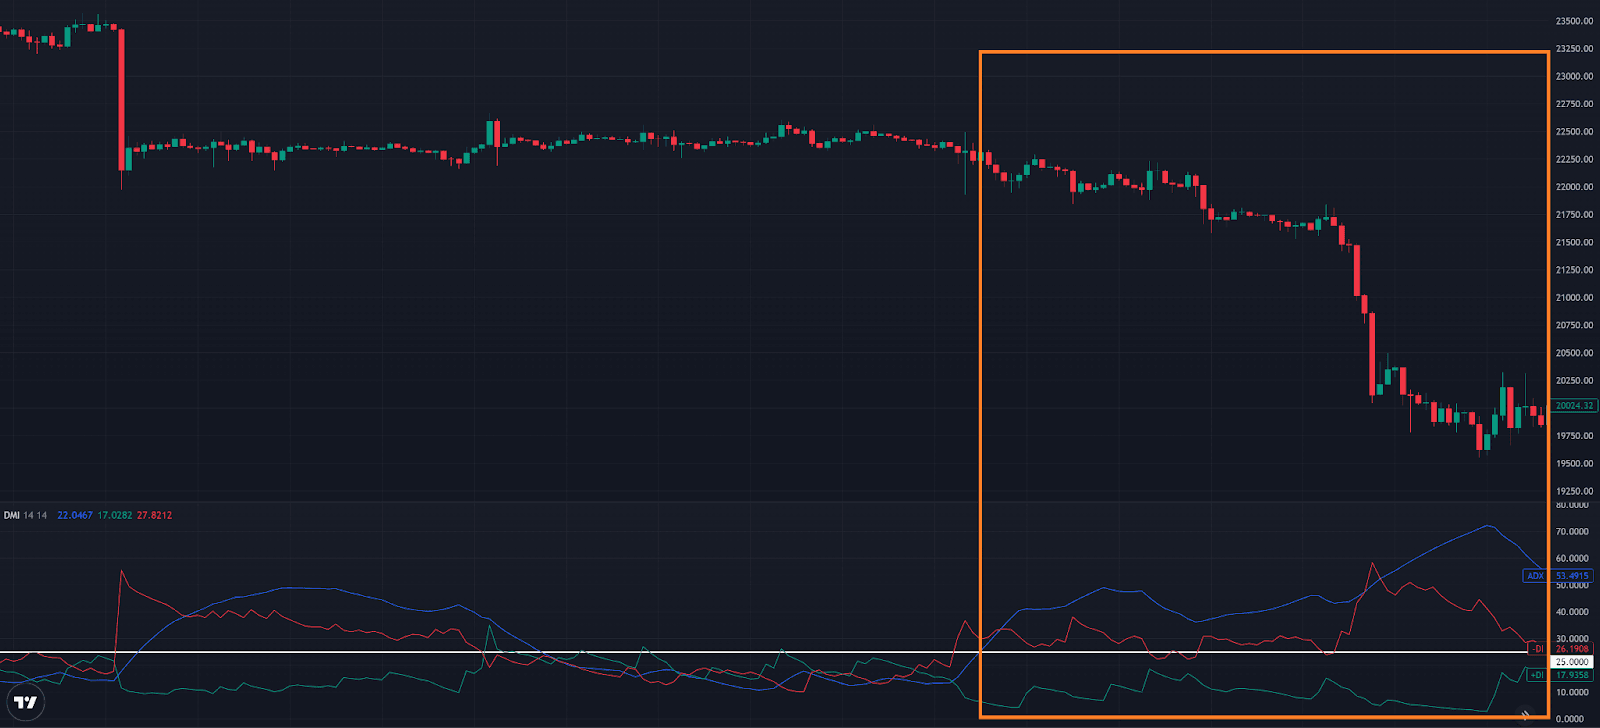
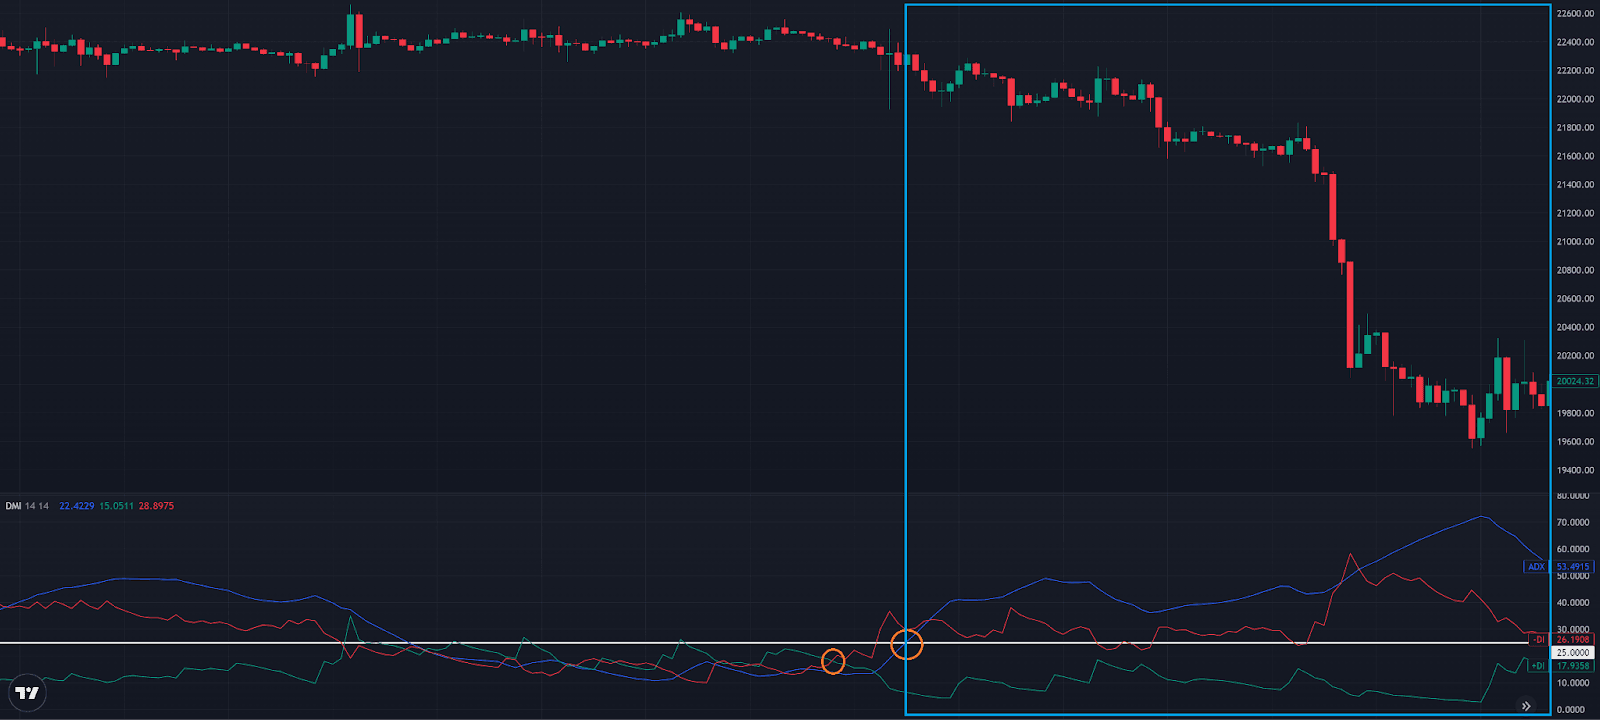
-DI > +DI Refers to a Trending Short Market
When -DI crosses above +DI, a golden cross occurs between -DI and +DI, suggesting -DI is upwards of +DI. This represents a bearish trend in the market, and if the ADX value rises above 25, it indicates that a short market trend is underway, namely, a higher chance of continued downward momentum.
How to Use the DMI Indicator to Identify Trends?
The DMI indicator emphasizes measuring the trend strength and direction of cryptos. This indicator can be used for trend identification as follows:
- 1. Check if ADX is greater than 25: ADX is another component of the DMI indicator, used to measure the trend strength. When the ADX value is above 25, the trend is generally considered strong, and the market has a clear direction, while ADX below 25 typically implies a weak trend in a consolidation phase. As a result, traders can enter the market when the trend is strong and exit as a weak trend comes.
- 2. Determine the positions of +DI and -DI: +DI is used to measure the strength of an uptrend, while -DI measures the strength of a downtrend. When +DI is higher than -DI, it is generally considered an upward trend, or a bullish trend. If -DI is above +DI, a downtrend is underway, indicating a bearish trend.
- 3. Comprehensively evaluate +DI, -DI, and ADX: If traders want to find a market with a clear direction and strong trend, the following methods can be used.
- a. Strong bullish trend: +DI > -DI and ADX > 25
- b. Strong bearish trend: -DI > +DI and ADX > 25
Can the DMI Indicator Work with Others?
The DMI indicator is good at assessing the strength of a trend but cannot determine whether the market is overly optimistic or pessimistic, or whether it is in an overbought or oversold condition. Therefore, it can be combined with the RSI indicator or Stochastic Oscillator (KD) indicator to improve the accuracy and reliability of trading signals.
Conclusion
While the DMI indicator may be more complicated to calculate and use, it is a highly accurate tool for making informed judgments. If it can be combined with data from different dimensions, such as fundamental data, improved market trend identification will lead to a more comprehensive analysis of the market.
FAQ
Q: How to use the DMI indicator in crypto trading?
A: The DMI indicator can identify clear trend turning points. The condition for determining a strong bullish trend is when +DI is higher than -DI, and ADX is above 25. As to a strong bearish trend, -DI exceeds +DI and ADX is greater than 25.
Q: How to use the DMI indicator to determine the market direction?
A: When the +DI value over a -DI value refers to a bullish trend, the -DI value superior to the +DI value manifests a bear trend.
This is not investment advice. Please conduct your own research when investing in any project.