What Is OBV Indicator in Trading and How to Use It?
2023-04-11 03:01:30
Preface: Brief Intro to the OBV Indicator
The On Balance Volume (short for OBV) indicator aims to measure buying and selling pressure based on trading volume to evaluate the market trend strength and price changes.
This indicator is calculated by combining the daily volume of a crypto asset with its price. A rise in price results in an increasing OBV indicator, indicating that buyers gain the upper hand. If the price drops, the OBV indicator falls, representing that sellers have the edge. When the OBV indicator presents an opposite trend to the price, it usually gives a signal of a market reversal.
What Is the OBV Indicator?
The OBV indicator is for quantitative technical analysis, helping find trends or reversal points by measuring the shift in the balance between buyers and sellers.
This indicator is calculated by accumulating or subtracting daily volume. The day’s volume is added to the OBV value when the price closes higher than the previous close, indicating a rise in bulls. On the other hand, the day’s volume is subtracted from the OBV value when the price closes lower than its previous close, implying an increasing number of bears. In addition, the OBV value remains unchanged if the day’s closing price is equal to the previous close.
The result of the OBV indicator refers to a cumulative total, displaying the strength changes between buyers and sellers. A rising OBV indicator means more buyers are stepping into the market, while a falling OBV indicator manifests an increase in sellers. Generally speaking, the volume change is proportional to the OBV trend, which reveals a stable and sound market trend. The OBV indicator is a useful tool for analyzing the price trend of assets and understanding the balance of buyers and sellers in the market. As such, a divergence between the price and OBV is interpreted as a reversal signal.
What Is the Formula to Calculate the OBV Indicator?
- 1. Set the OBV value of the first day to 0.
- 2. If the 24-hour closing price is greater than the previous close then:
OBV= Previous OBV + 24-hour volume
- 3. If the 24-hour closing price is less than the previous close then:
OBV=Previous OBV - 24-hour volume
- 4. If the 24-hour closing price is equal to the previous close then:
OBV=Previous OBV
So, the formula is as follows:
OBV=Previous OBV ± 24-hour volume
“±” depends on the gap between the day’s close and the previous close.
The OBV value can also be averaged to determine the change in trading volume momentum over a period of time, and 20 is taken as the parameter of the OBV SMA.
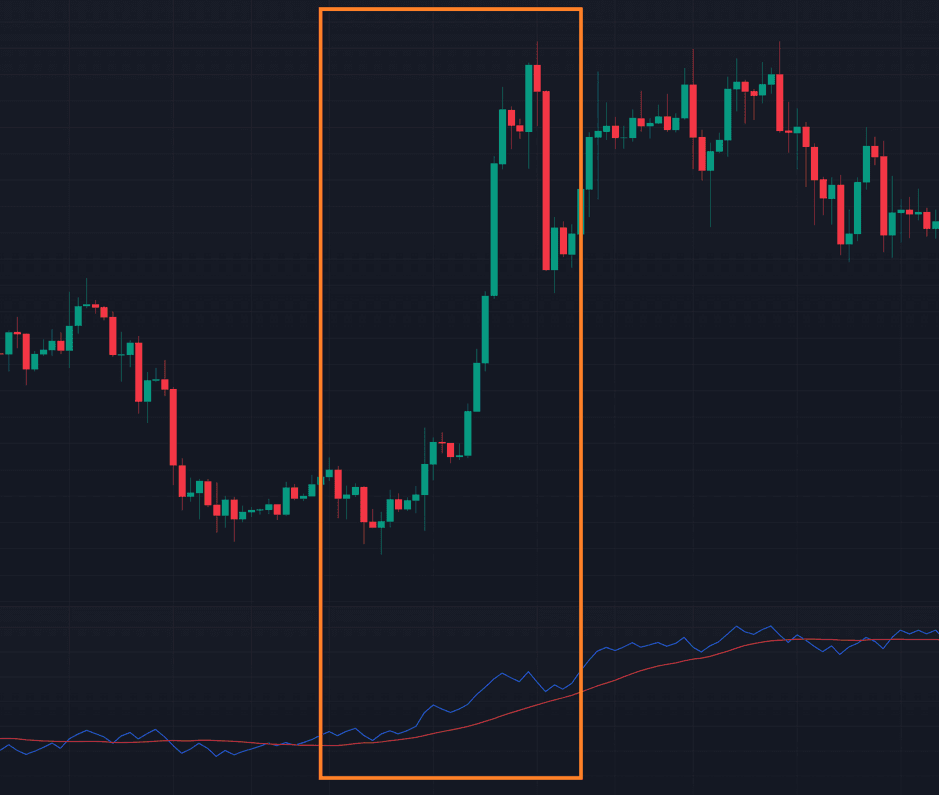
As shown in the following figure, a line in blue refers to the OBV indicator, and a line in red represents the OBV SMA.

What Are OBV’s Principles and Features and How to Use it to Identify Market Trends?
The principle of the OBV indicator measures the bull and bear strength based on the relationship between trading volume and crypto price movements. Combining daily volume with closing price changes, the OBV indicator reflects the buying and selling momentum by calculating the current day’s OBV value via the previous OBV value plus or minus volume.
A rising OBV value accompanied by an upward price manifests a stable and robust price trend, indicating a high chance of continued rise later.
Features of the OBV Indicator:
- 1. The OBV indicator offers valuable information about the stability of an asset’s trend and enables investors to discern the prevailing sentiment of buyers and sellers in the market. When the OBV indicator rises, it means that the number of buyers is increasing, and the following crypto price is more likely to rise. Similarly, if the OBV indicator falls, sellers have the edge, and there is a higher chance of price drops later.
- 2. The OBV indicator can be used to find signals of trend reversals. When the OBV indicator runs counter to the price trend, it is usually interpreted as a sign of a reversal in the market trend. For example, if a rising stock price witnesses a drop in the OBV indicator, the price may be on the verge of falling.
- 3. Easy to use: The OBV indicator is a user-friendly tool that can be easily applied by calculating the closing price and volume change over a specific period.
- 4. Extensive applications: Since the OBV indicator is very simple, it has a broad range of use across various markets, including cryptocurrencies, stocks, futures, foreign exchange, etc.
Common OBV Patterns
The OBV indicator provides traders with an intuitive means of analyzing price movements. It can be compared with the price trend, and the OBV SMA can also be used as a reference. This indicator can not only identify trends but also find potential price reversals in advance through divergence movements.
OBV Trend Proportional to the Price
It’s common for prices to rise or fall in response to an upward or downward OBV, respectively, which indicates that the market is more likely to continue moving in its original direction.
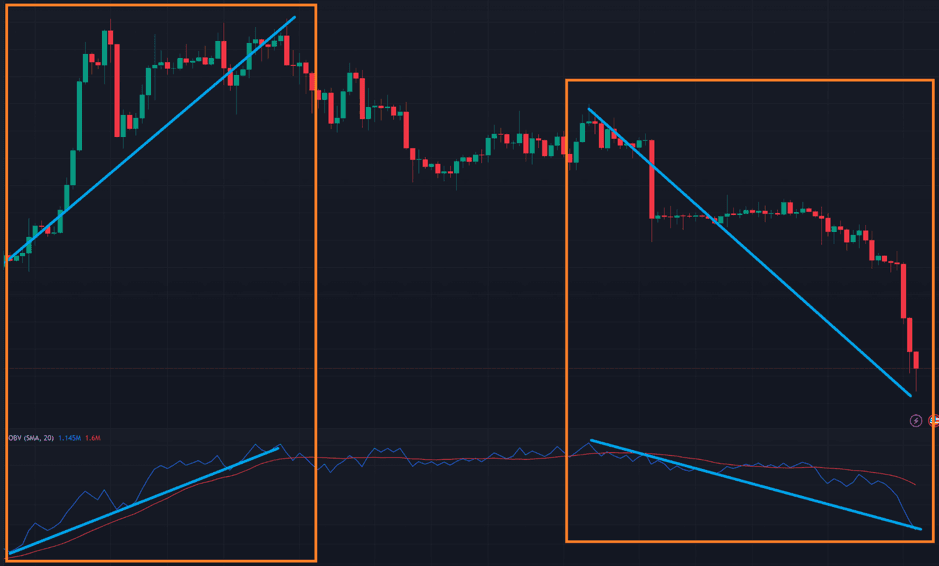
OBV Divergence
In technical analysis, an OBV divergence indicates that the market price trend is the reverse of the OBV trend. In the following figure, the BTC price has risen for a certain period of time, while the OBV indicator has fallen, leading to a divergence that gives a reversal signal of the market trend. Thus, BTC may tumble later.

How to Use the OBV Indicator?
The OBV indicator is conducive to identifying volume trends and shifts in the balance between buyers and sellers. It can be used as follows:
- 1. Identify the trend: The OBV indicator can be used to identify the trend via the change in buying and selling power. Monitoring the OBV indicator movement can provide insights into the overall market trend. If the OBV indicator shows a consistent uptrend over time, it may mean that the buyers have the upper hand to pick up the market momentum. If the OBV indicator is falling, it indicates that the sellers may be on the rise, implying a chance of a falling market.
- 2. Determine the reversal point via OBV divergence: When a divergence occurs between the market price and the OBV indicator, it usually delivers a reversal signal. If a cryptocurrency price climbs with a falling OBV indicator, the market may turn down. If the price falls, but the OBV indicator gets higher, this may signal that the market is about to turn up.
When both price and OBV are making higher peaks and higher troughs, the buying trend may control the market. Therefore, buying in is recommended. However, if both price and OBV are falling, it indicates the selling trend may prevail, so selling out is favorable.
Can the OBV Indicator Work with Others?
To improve accuracy, the OBV indicator can work with other tools, such as the Relative Strength Index (RSI) indicator, the Moving Average Convergence Divergence (MACD) indicator, the Stochastic Oscillator (KD) indicator, and other technical indicators, as well as with the fundamental analysis.
Conclusion
The OBV indicator can be used to gauge market sentiment and predict potential price movements. When the OBV indicator is rising, more buyers may enter the market, indicating a bullish trend. As the OBV indicator goes south, it indicates that seller power is increasing so the asset price will probably continue to fall in the future. In addition, the OBV indicator can also be used to look for signals of trend reversals and to better understand and analyze market trends with other indicators.
FAQ
Q: How to use the OBV indicator in crypto trading?
A: When the OBV indicator and the price are in an uptrend, it may indicate that the market is peppered with buyers, so buying assets is recommended. If the OBV indicator falls as a drop in price, the selling trend may dominate the market. As a result, a sell trade is proper.
This is not investment advice. Please conduct your own research when investing in any project.