What Is MACD Indicator in Trading and How to Use It?
2023-03-24 03:53:25
Preface: Brief Intro to the MACD Indicator
The Moving Average Convergence Divergence (MACD) is a trend-following momentum indicator for technical analysis. It is used to measure the trends and momentum shifts of trading assets. Due to its good identification of medium- and long-term trends, the MACD indicator is well received by numerous traders.
What Is the MACD Indicator?
The MACD indicator consists of the following elements: two exponential moving averages (EMAs) – 12-period EMA and 26-period EMA, a signal line, a MACD line, and a histogram. The first EMA is calculated over a shorter timeframe, typically 12 periods, and the second EMA is calculated over a longer timeframe, typically 26 periods. The MACD line is calculated by subtracting the 26-period EMA from the 12-period EMA. The signal line is calculated by a 9-period EMA of the MACD line. The histogram graphs the distance between the MACD line and its signal line, which refers to the change in market trends and momentum.
What Is the Formula to Calculate the MACD Indicator?
- 1. Calculate the 12-period EMA and the 26-period EMA.
- 2. Subtract the 26-period EMA from the 12-period EMA to obtain the MACD line.
MACD line = 12-period EMA - 26-period EMA
- 3. Calculate the 9-period EMA of the MACD line to obtain the signal line
Signal line = 9-period EMA of the MACD Line
- 4. Plot the MACD line and the signal line on a chart.
MACD histogram = MACD line – Signal line
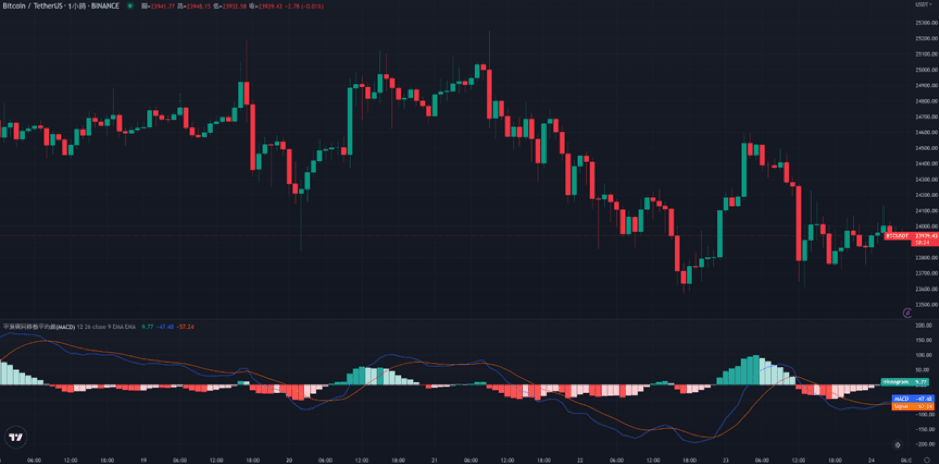
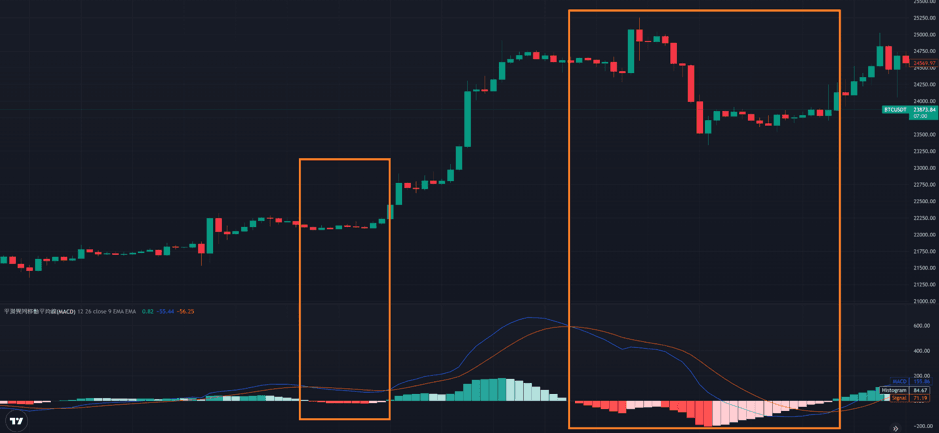
In the following figure, the lines in blue and orange refer to the MACD line and the signal line, respectively. A histogram in green means it is above the zero line, and that one in red indicates it is below the zero line.
What Are MACD’s Principles and Features and How to Use it to Identify Market Trends?
The MACD line, signal line, and histogram can be used to identify mid-term trends, long-term trends, and the whole trend, respectively. If the MACD line crosses above the signal line, the indicator gives a buy signal. In contrast, if the MACD line crosses below the signal line, the indicator gives a sell signal.
The MACD histogram is plotted based on a baseline which is calculated by subtracting the signal line from the MACD line. A positive value represents that the MACD line is above the signal line, while a negative value means that the MACD line is below the signal line. The MACD histogram changes indicate trend shifts and momentum strength, helping traders to identify market trends and develop trading strategies accordingly.
Features of the MACD Indicator:
- 1. Access to both price directions and momentum shifts: The MACD indicator assists traders to identify medium- and long-term price directions via the divergence between 12-period EMA and 26-period EMA and the relative positions of the MACD and signal lines. The market momentum can be determined by histogram size.
- 2. Simple and convenient operation: It’s easy to understand the calculation of the MACD indicator by calculating 12-period EMA, 26-period EMA, and signal line.
- 3. Useful trading signals: If a golden or death cross happens between the MACD and signal lines, traders interpret it as a buy or sell signal and develop clear trading strategies.
- 4. Extensive application: The MACD indicator has a broad range of use across various markets, including cryptocurrencies, stocks, futures, foreign exchange, etc.
Common MACD Patterns
Despite the complex operation of the MACD indicator over other technical analysis indicators, it is easy to use. Common patterns are shown as below:
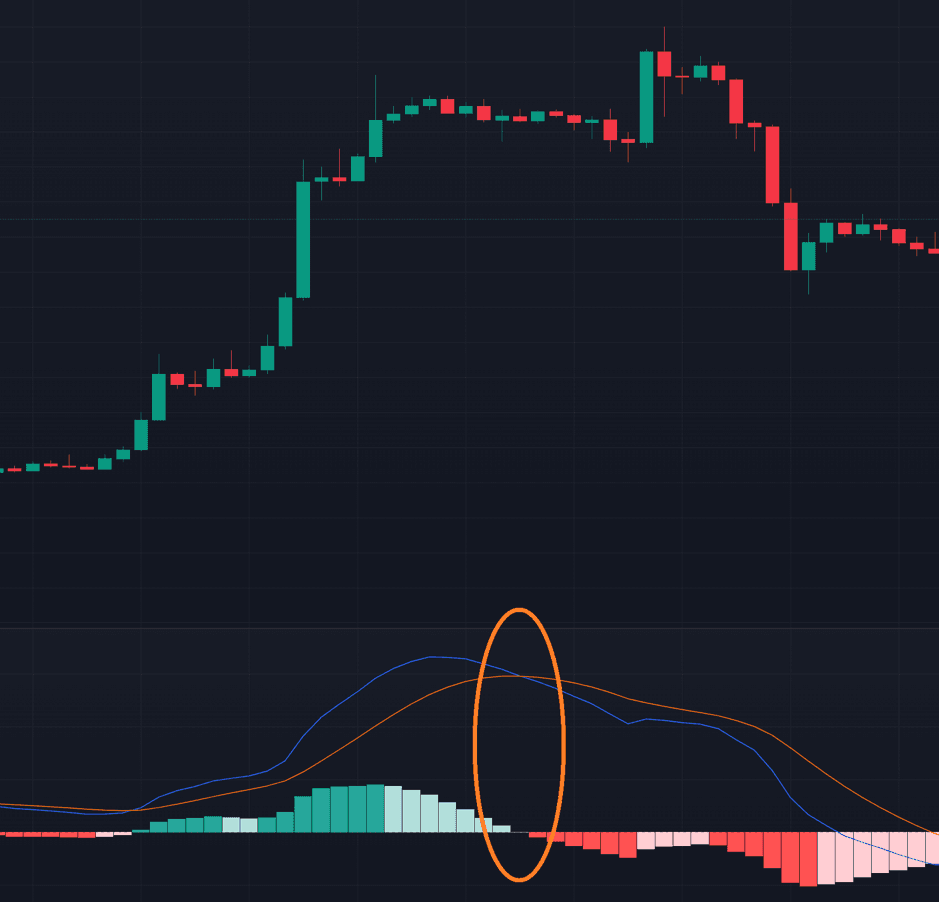
MACD Death Cross
A death cross refers to the MACD line crossing below the signal line. It is a bearish signal, indicating a high possibility of a downtrend.

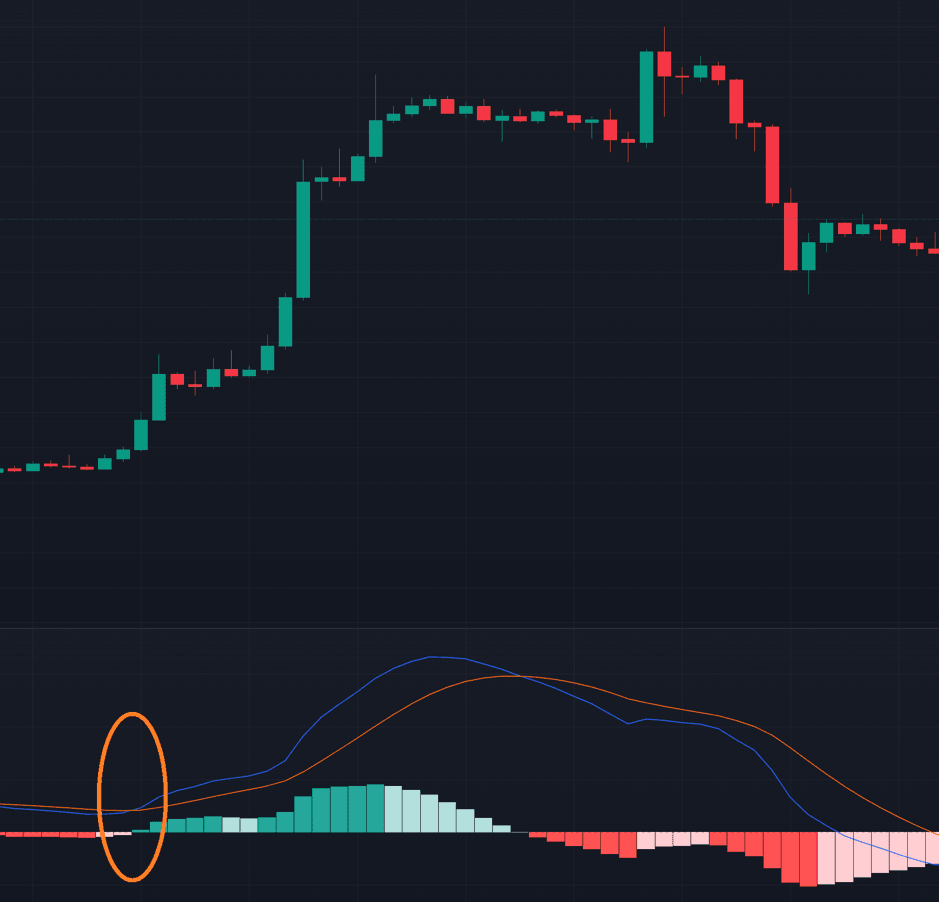
MACD Golden Cross
A golden cross represents the MACD line crossing above the signal line. It is a bullish signal which suggests a high possibility of an uptrend.

Histogram Above the MACD’s Baseline
A histogram is calculated by subtracting the signal line from the MACD line. If the MACD line is above the signal line, the histogram is a positive value above the baseline, or zero line. It is a bullish signal, indicating a high possibility of an uptrend.
Histogram Below the MACD’s Baseline
A histogram is calculated by subtracting the signal line from the MACD line. If the MACD line is below the signal line, the histogram is a negative value below the baseline. It is a bearish signal, indicating a high possibility of a downtrend.
How to Use the MACD Indicator?
The MACD indicator can be widely applied in different markets, such as cryptos, stocks, futures, foreign exchange, etc.
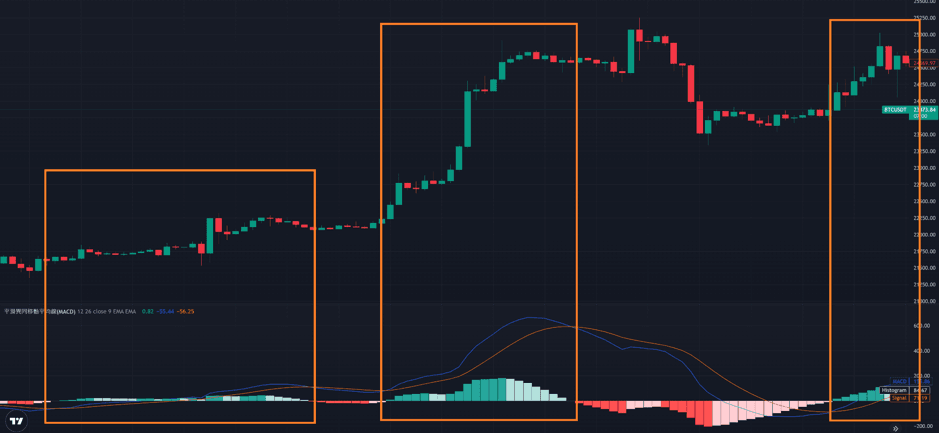
- 1. The relative positions of the MACD line and the signal line usually suggest that if the MACD line crosses above the signal line, the market enters a long trend. In contrast, if the MACD line crosses below the signal line, the market enters a short trend.
- 2. The MACD histogram changes indicate that the greater the change in MACD histograms, the more volatile the market. Conversely, if the MACD histogram size becomes smaller or approaches the zero line, the market trend is relatively stable with low volatility.
Can the MACD Indicator Work with Others?
This indicator can be used along with other tools, such as the Relative Strength Index (RSI) indicator, Bollinger Band, candlestick forms, and other technical indicators, to improve the accuracy of technical analysis. It can also be used together with fundamental analysis.
Conclusion
The MACD indicator can assist traders to identify market trends and momentum shifts, especially the medium- and long-term trends. Furthermore, it can be used to set the entry and exit points in trading strategies. It is important to note, however, that the MACD indicator is only a technical analysis tool and shouldn’t be used alone for trading decisions. To reduce risks and improve trade accuracy, it’s recommended to combine the MACD indicator with other technical analysis tools and fundamental analysis for comprehensive judgments.
FAQ
Q: How to use the MACD indicator in crypto trading?
A: For crypto trading, it is required to set the candlestick chart to a relative short timeframe, such as a 1-hour, 30-minute, or 15-minute candlestick chart, or even shorter cycles. If the MACD line crosses above the signal line, the market starts a long trend. Thus, you can go long as required. If the MACD line is below the signal line, the market enters a short trend. In this case, you can go short as you wish.
Q: Is RSI more reliable than MACD?
A: Both of the two indicators are reliable for technical analysis. You are advised to select a suitable indicator based on your own trading habits and logic.
This is not investment advice. Please conduct your own research when investing in any project.