Common Indicators in Technical Analysis
2023-02-21 08:02:25
Technical analysis involves the use of a variety of indicators to predict future price movements in cryptocurrencies. In this guide, we will provide an introduction to a selection of commonly used technical indicators in cryptocurrency trading and offer practical guidance on their implementation.
How to Apply Technical Analysis?
Technical analysis is like a toolbox, housing an array of tools, each with its own unique application scenario. Different technical indicators are suitable for varying market conditions, such as longer-term cycles or identifying trend changes. It is crucial to grasp the characteristics of each indicator in order to utilize them to their fullest potential.
As a significant analytical method, technical analysis is focused on utilizing historical market data to anticipate the market's future direction. The success of this method is reliant on the user's ability to skillfully select and apply the indicators. To facilitate your analysis, this article will introduce you to several commonly used indicators in technical analysis.
1. Moving Average Indicator- 2. Relative Strength Index
- 3. Stochastic oscillator
- 4. MACDMoving Average Convergence Divergence
- 5. Bollinger Band
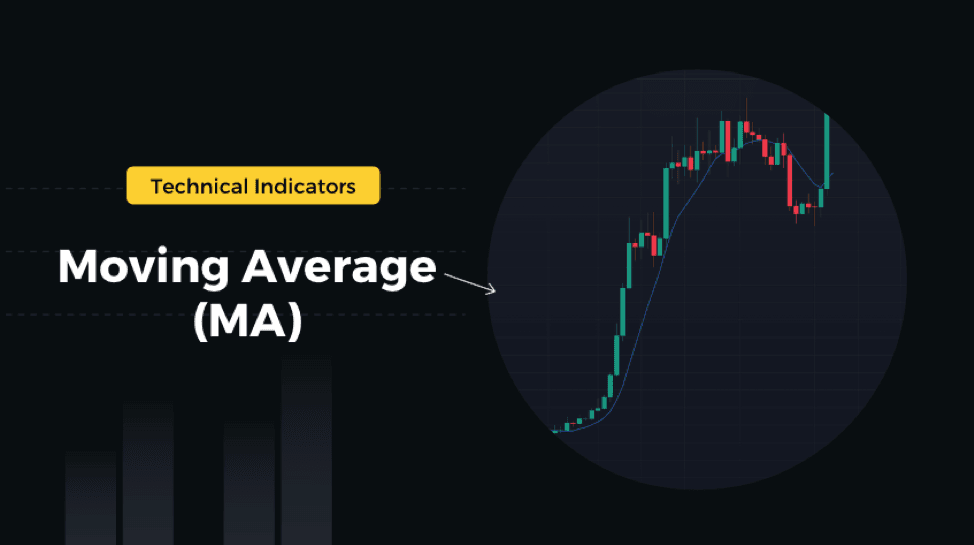
Moving Average Indicator (MA)
The Moving Average (MA) Indicator is a technical analysis tool that calculates the average price of a security over a specific period of time. It is often used as a trending tool to identify price trends, whether they be short, medium, or long-term, depending on the parameters selected. The MA Indicator is calculated by taking the average of prices over the specified period, and can help to smooth out short-term price fluctuations. Some commonly used types of moving averages include the Simple Moving Average and the Exponential Moving Average. Traders and investors use the resulting line, plotted on a chart, to identify potential entry and exit points for a security.
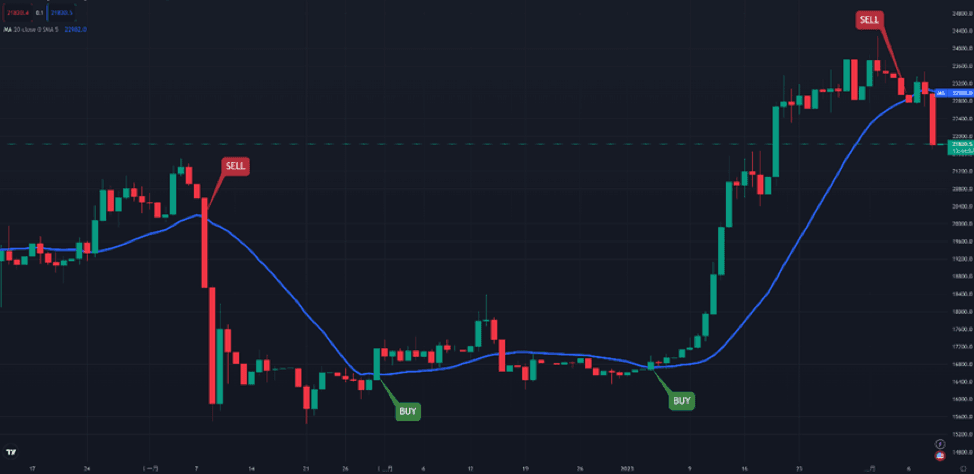
Source: TradingView
What Is the Formula to Calculate the Moving Average?
The Moving Average (MA) is a commonly used technical analysis indicator that involves calculating the average price of an asset over a specific period of time. One type of Moving Average is the Simple Moving Average (SMA), which is calculated by adding together the asset's closing prices from the first day of the time period to the last day, and then dividing the sum by the number of days. For example, the formula for a 10-day SMA would be:
SMA = (closing price on day 1 + closing price on day 2 + ... + closing price on day 10) ÷ 10
This would give you the average closing price for the past 10 days. To get the SMA for the current day, you would need to use the closing price from the most recent day in the time period.
How to Use Moving Averages to Identify Trends: Tips and Strategies
To determine the relationship between price and the Moving Average, you can examine whether the price is above or below the MA. If the price is above the MA, this typically indicates a strong and bullish market. Conversely, if the price is below the MA, this typically indicates a weak and bearish market.
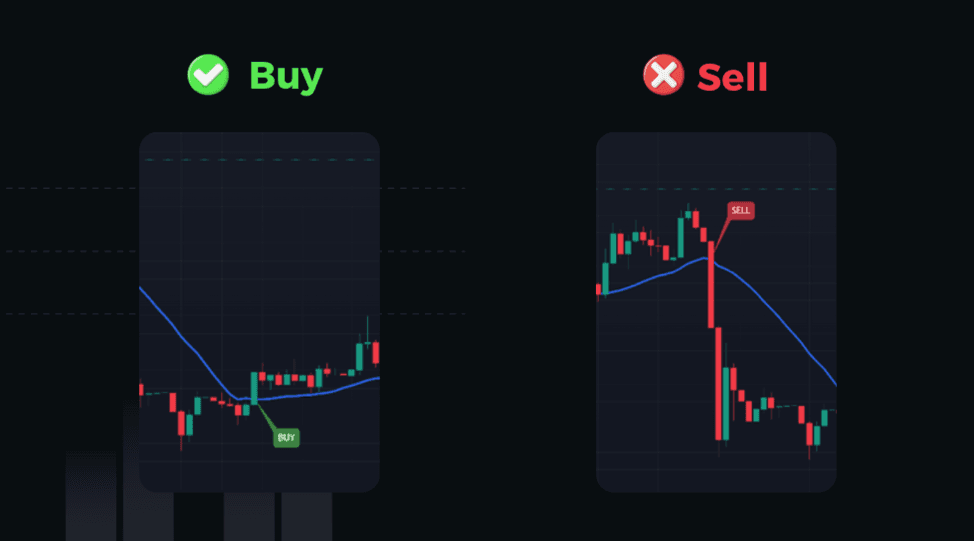
In addition, you can use the crossing of the price and the MA to trigger a trade. When the price crosses the MA from bottom to top, this suggests a strong market and may be a good time to buy. Conversely, when the price crosses the MA from top to bottom, this suggests a weak market and may be a good time to sell or short the market.
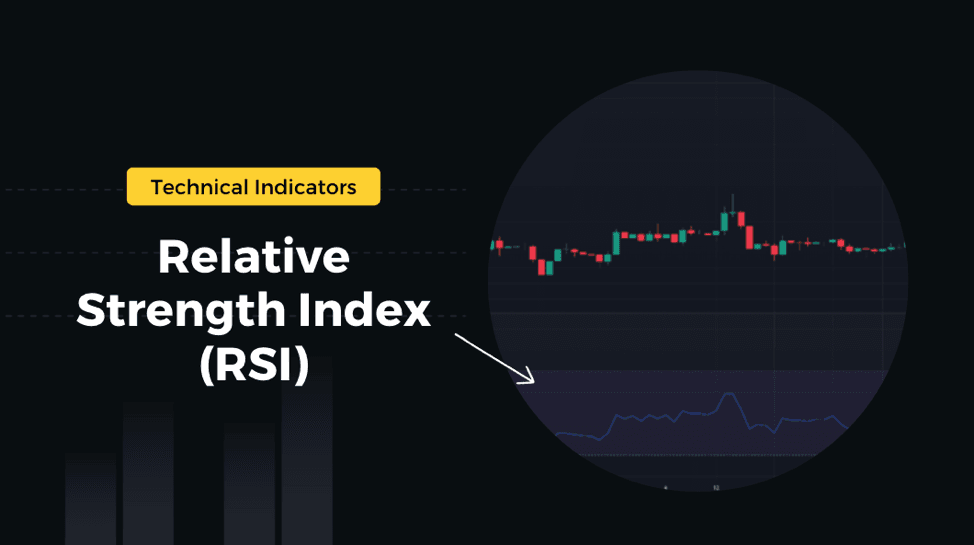
Relative Strength Index (RSI)
The Relative Strength Index (RSI) is a technical analysis indicator used to measure the strength and momentum of a financial instrument, such as a stock or a currency pair. J. Welles Wilder Jr. created the RSI in 1978 to evaluate overbought and oversold conditions in the financial market, and it has since become one of the most significant tools for determining such conditions in the cryptocurrency market. The RSI calculates the strength of the cryptocurrency market by analyzing how much the closing price has risen and fallen over a specified time period, thereby generating trading signals. Traders and investors use the RSI to identify whether an asset is overbought or oversold and to make buy or sell decisions. The RSI is usually plotted on a scale of 0 to 100, with values above 70 indicating that the asset is overbought, and values below 30 indicating that the asset is oversold.
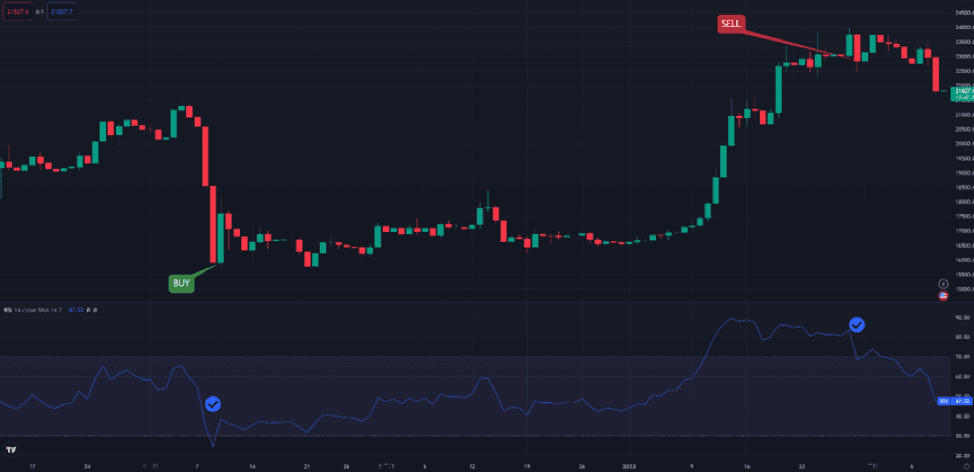
Source: TradingView
What Is the Formula to Calculate the Relative Strength Index?
The process of calculating the Relative Strength Index (RSI) involves two steps.
1. Average of Upward Price Change: To calculate the average upward price change, you sum the difference between each day's closing price and the previous day's closing price if it is positive, over a period of N days. Then, you divide that sum by N to get the average upward price change over the period. Mathematically, the formula for the average upward price change is:
Average Upward Price Change = (Sum of Positive Price Changes over N Days) / N
2. Average of Downward Price Change: To calculate the average downward price change, you sum the difference between each day's closing price and the previous day's closing price if it is negative, over a period of N days. Then, you divide that sum by N to get the average downward price change over the period. Mathematically, the formula for the average downward price change is:
Average of Downward Price Change = (Sum of Negative Price Changes over N Days) / N
3. To simplify the calculation, the two steps can be combined into a single formula. The final formula for RSI is:
RSI = 100 - [100 / (1 + (Average of Upward Price Change / Average of Downward Price Change))]
*Note that N is a parameter that is typically set to 14 days.
This formula calculates the RSI value by dividing the average of upward price change by the average of downward price change and adding 1, then dividing 100 by that sum and subtracting the result from 100. The resulting RSI value ranges from 0 to 100 and indicates whether the asset is overbought or oversold.
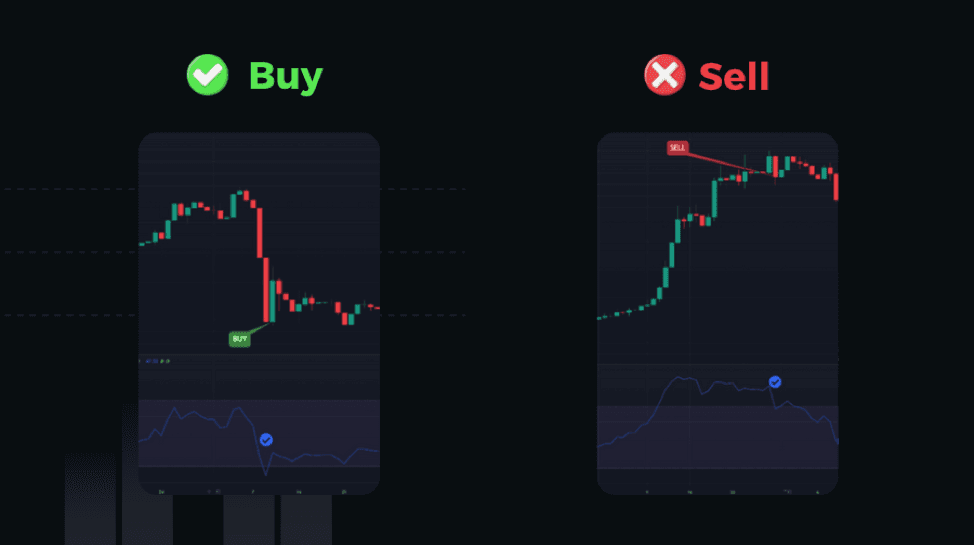
How to Use RSI to Identify Trends: Tips and Strategies
The RSI is a useful tool for determining overbought and oversold conditions in the market.
- 1. If the RSI is above 70, it is considered overbought, indicating that the price may be due for a reversal or correction. In such a situation, traders may consider selling or shorting the asset.
- 2. If the RSI is below 30, it is considered oversold, indicating that the price may have fallen too far and could be due for a rebound. In this case, traders may consider buying or going long on the asset.
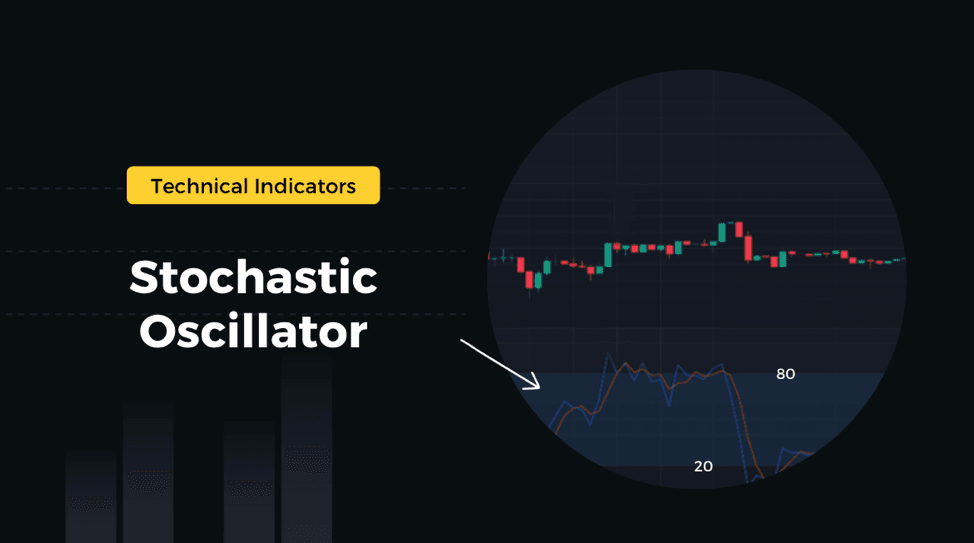
Stochastic Oscillator Indicator
The Stochastic Oscillator is a popular technical analysis indicator used in trading to measure the momentum of a particular asset. It was developed by George C. Lane in the 1950s and is designed to evaluate whether an asset's price has exceeded its intrinsic value. The oscillator uses the principles of stochastic mathematics to calculate the variation in the current price relative to the asset's highest and lowest prices over a specified period of time. The resulting data is then plotted on a range of 0-100, providing insights into the strength of the buying and selling positions for cryptocurrencies. Traders use the Stochastic Oscillator to identify overbought and oversold conditions in an asset. By mapping this data onto a 0-100 range, the Stochastic Oscillator offers valuable insights for making informed trading decisions.
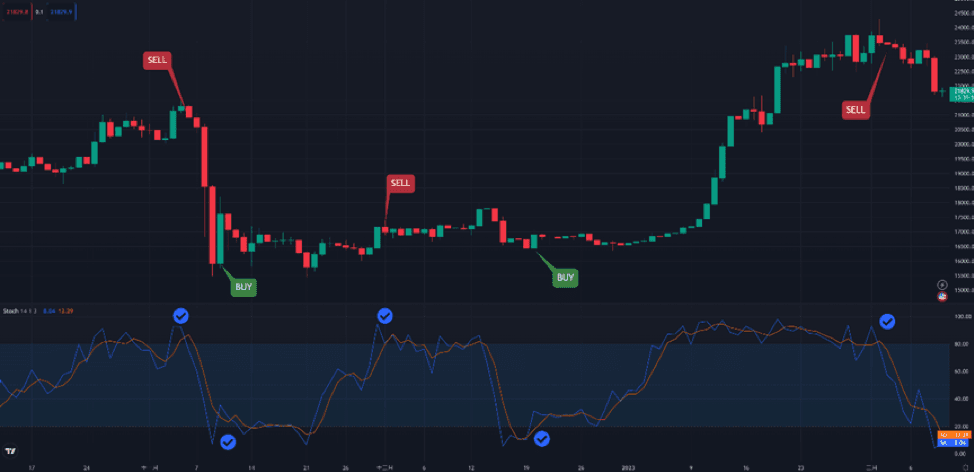
Source: TradingView
What Is the Formula to Calculate the Stochastic Oscillator Indicator?
The stochastic Oscillator indicator is made up of two lines: the %K line and the %D line. The %K line is the main line and the %D line is a moving average of the %K line.
- 1. The %K line is calculated by comparing the current closing price to the high and low price over a given period.
- 2. The %D line is a moving average of the %K line and is typically calculated using a 3-day simple moving average.
The calculation formula is as follows:
%K = 100 * [(Today's Close - Lowest Price) / (High - Lowest Price)]
In this formula, "Today's Close" is the closing price of the current period, "Lowest Price" is the lowest price observed in the specified period, and "High" is the highest price seen in the same period.
%D = N-period MA of %K
*N refers to the number of days of the simple moving average.
How to Use Stochastic Oscillator to Identify Trends: Tips and Strategies
It is a momentum indicator that compares a security's closing price to its price range over a given period. The stochastic oscillator is typically used to identify overbought and oversold conditions in a security. Here are some tips and strategies for using the stochastic oscillator to identify trends:
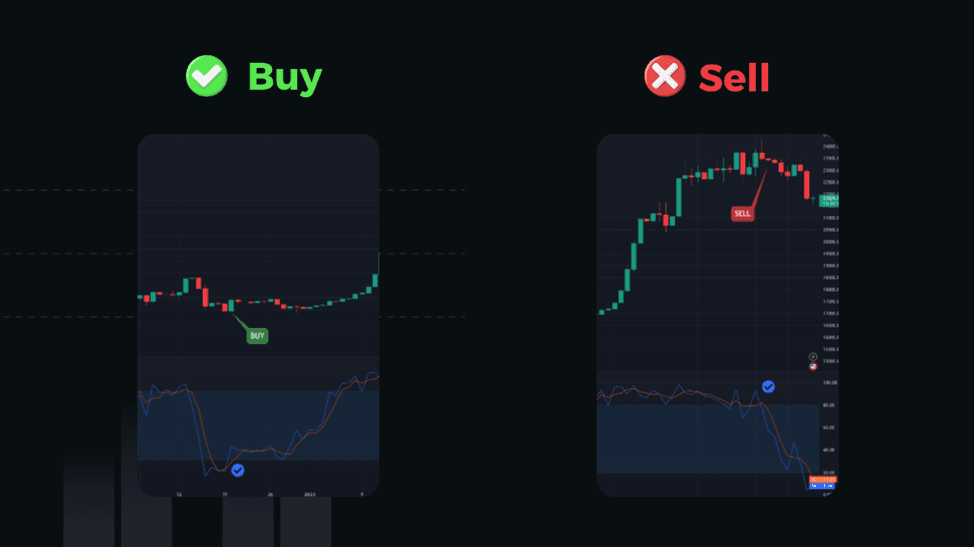
- 1. Use the stochastic oscillator to confirm trends: When the two lines of the stochastic oscillator cross each other in the overbought or oversold region, this is known as a crossover signal. In the oversold region, an increasing %K line crossing above the %D line is considered a buy signal. Conversely, in the overbought region, a decreasing %K line crossing below the %D line is interpreted as a sell signal.
- 2. Use the stochastic oscillator to identify overbought and oversold conditions: The Stochastic Oscillator generates a scale reading that ranges from 0 to 100. When the %D value exceeds 80, the security is considered to be overbought, indicating a potential for a market correction or a price reversal. On the other hand, when the %D value falls below 20, the security is considered oversold, which suggests a possible buying opportunity or price recovery.
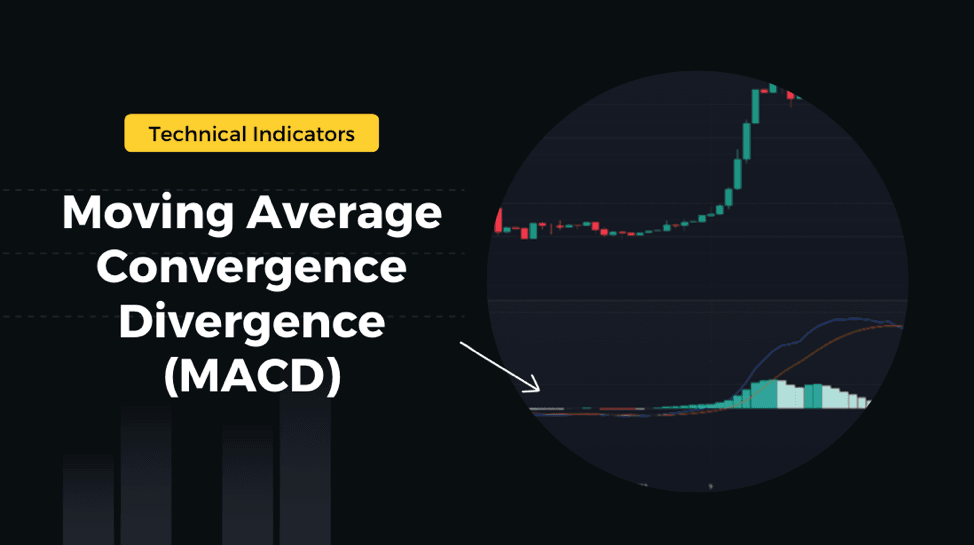
Moving Average Convergence Divergence (MACD)
Moving Average Convergence Divergence (MACD) is a technical analysis tool used to identify trend reversals and momentum shifts in financial markets. The MACD indicator is calculated using two exponential moving averages (EMAs) - a faster EMA and a slower EMA. The first EMA is calculated over a shorter time frame, typically 12 periods, and the second EMA is calculated over a longer time frame, typically 26 periods. The difference between these two EMAs is plotted as a histogram, and a nine-period EMA of the histogram is then plotted as a signal line. Its primary function is to track the progression of trends and ascertain their robustness. Traders use the MACD to identify buy and sell signals and to confirm the strength of a trend.
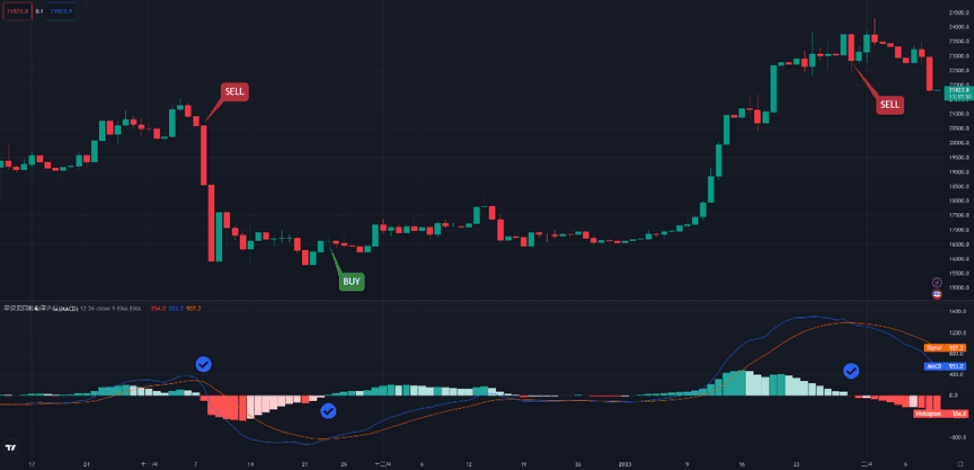
Source: TradingView
What Is the Formula to Calculate the MACD?
1. Calculate the 12-day exponential moving average (EMA) of the security's price and the 26-day EMA of the security's price.
2. Subtract the 26-day EMA from the 12-day EMA to obtain the DIF line.
DIF Line = 12-day EMA - 26-day EMA
3. Calculate a 9-day EMA of the MACD line to obtain the signal line.
Signal Line = 9-day EMA of the DIF Line
4. Plot the MACD line and the signal line on a chart.
MACD = DIF - MACD
How to Use MACD to Identify Trends: Tips and Strategies
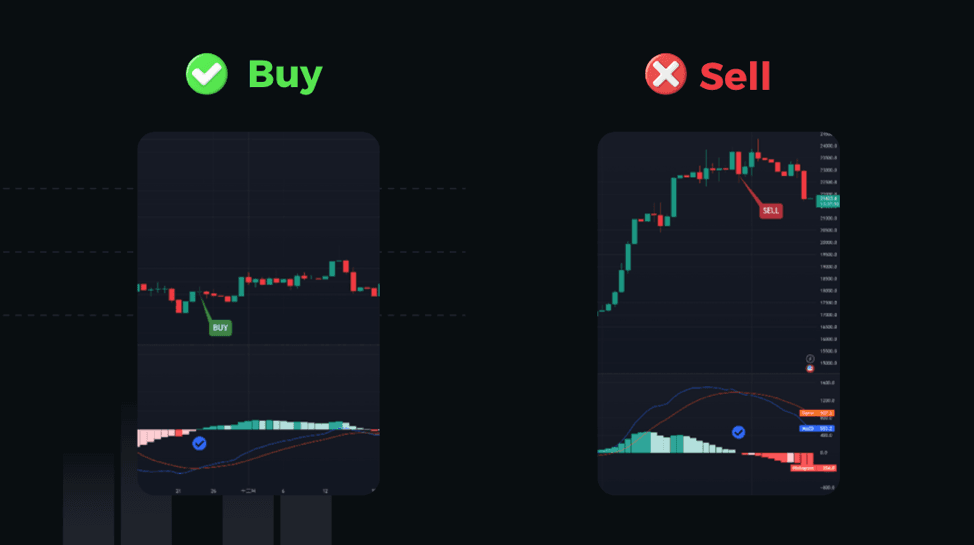
A bullish market can be identified by a MACD bar chart above 0, which serves as a reliable buy or long signal.
A bearish market can be recognized by a MACD histogram reading below 0, which serves as a suitable sell or short signal.
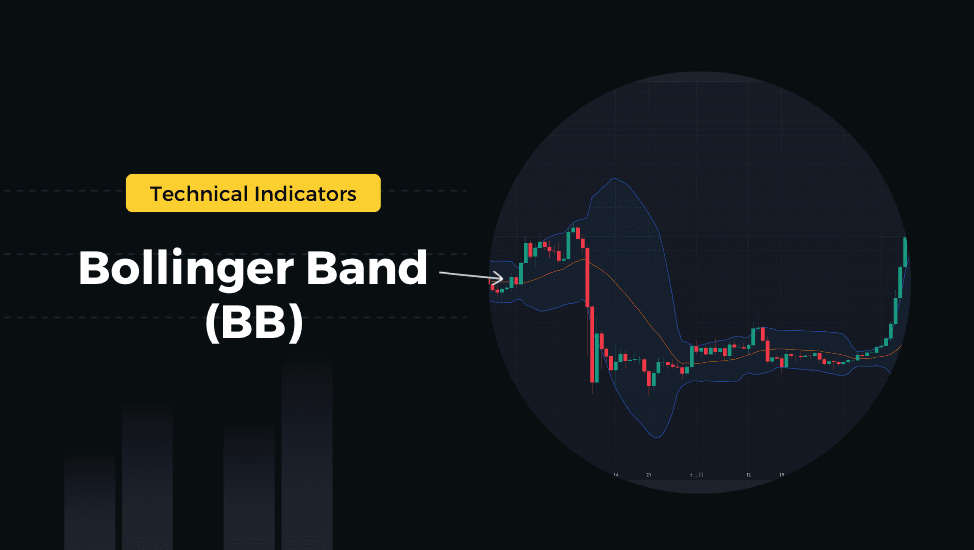
Bollinger Band (BB)
Bollinger Bands (BB) are a widely used technical indicator in stock analysis that helps assess whether a stock's price has gone beyond its typical range of movement. They consist of a middle line, which is usually a moving average, along with two upper and lower bands. If the stock's price crosses the upper band, the asset may be considered overbought, while if it crosses the lower band, it may be deemed oversold. By using Bollinger Bands, investors can get an idea of when to buy or sell an asset.
Source: TradingView
What Is the Formula to Calculate the Bollinger Band Indicator?
1. Middle Line: Calculate the Simple Moving Average (SMA):
SMA = (Sum of closing prices over n periods) / n
2. Calculate the standard deviation (SD) of the closing prices over the same n periods:
SD = sqrt[(1/n) * Sum[(closing price - SMA)^2]]
3. Calculate the Upper Bollinger band (UBB):
UBB = SMA + (SD* K)
4. Calculate the Lower Bollinger Band (LBB):
LBB = SMA - (SD* K)
Note: The value of K is typically set to 2, meaning that the Upper and Lower Bollinger Bands are set at two standard deviations above and below the SMA.
How to Use BB to Identify Trends: Tips and Strategies
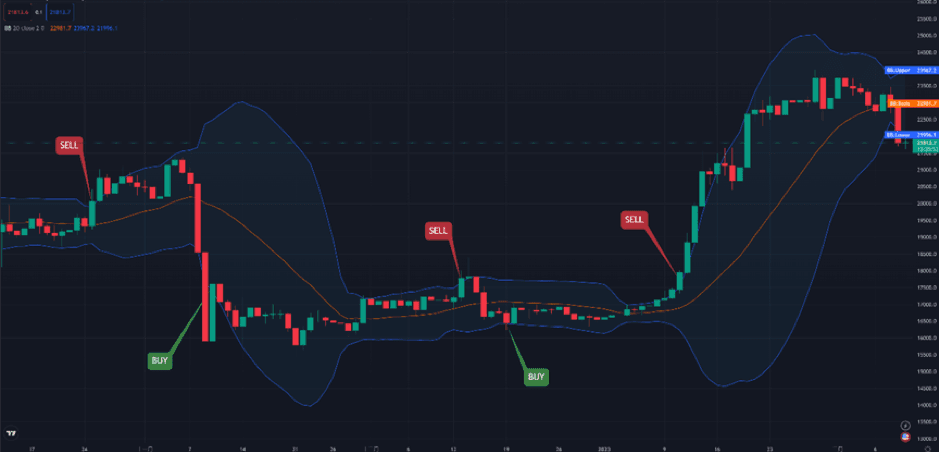
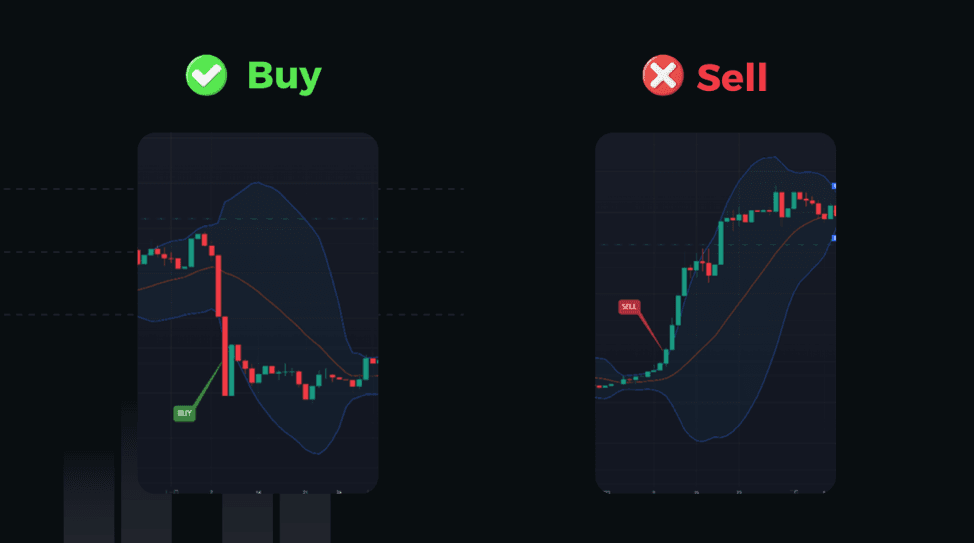
To identify potential buying opportunities, you can use the lower boundary of the Bollinger Bands. When the price of an asset falls below this threshold, it suggests that the asset is currently oversold, indicating a possible upward trend. In such cases, it may be worth considering buying or going long on the asset.
On the other hand, the upper boundary of the Bollinger Bands can be used to identify potential selling opportunities. If the price of an asset rises above this boundary, it suggests that the asset is currently overbought, indicating a possible downward trend. In such cases, it may be worth considering selling or shorting the asset.
How Do You Choose the Right Technical Indicators for Crypto Trading?
When selecting technical indicators, it is important to avoid relying solely on technical analysis as it may not always be accurate and should not be the sole basis for trading decisions. Other factors such as market fundamentals and marco economy factors should also be taken into consideration. To effectively choose a technical analysis indicator, it is essential to have a thorough understanding of its fundamentals, including its calculation and practical usage. Moreover, it is crucial to create a well-defined trading plan that incorporates the chosen indicators, including entry and exit points, stop-loss and take-profit, to effectively manage risk. Technical analysis should be viewed as a tool, which when combined with other important factors such as market sentiment, political and economic conditions, can help inform trading decisions.
FAQ
Q: What technical indicators are best for trading cryptocurrency?
A: The choice of technical indicators for trading cryptocurrency can depend on various factors. Some popular indicators used in cryptocurrency trading include Moving Averages(MA), Relative Strength Index (RSI), Stochastic oscillator, Moving Average Convergence Divergence(MACD), and Bollinger Bands. However, it is important to note that the effectiveness of these indicators can vary depending on the market conditions and the trader's individual strategy. Ultimately, the selection of technical indicators should be based on a thorough understanding of their fundamentals and practical application in the context of the specific cryptocurrency being traded.
Q:What technical indicators are most useful for trading cryptocurrencies?
A: Of all the technical analysis indicators available, moving averages are widely recognized as one of the most versatile and commonly used tools for analyzing market trends.
This is not an investment advice. Please conduct your own research when investing in any project.