Understanding cryptocurrency technical analysis charts for new traders
2025-06-18 09:02:53
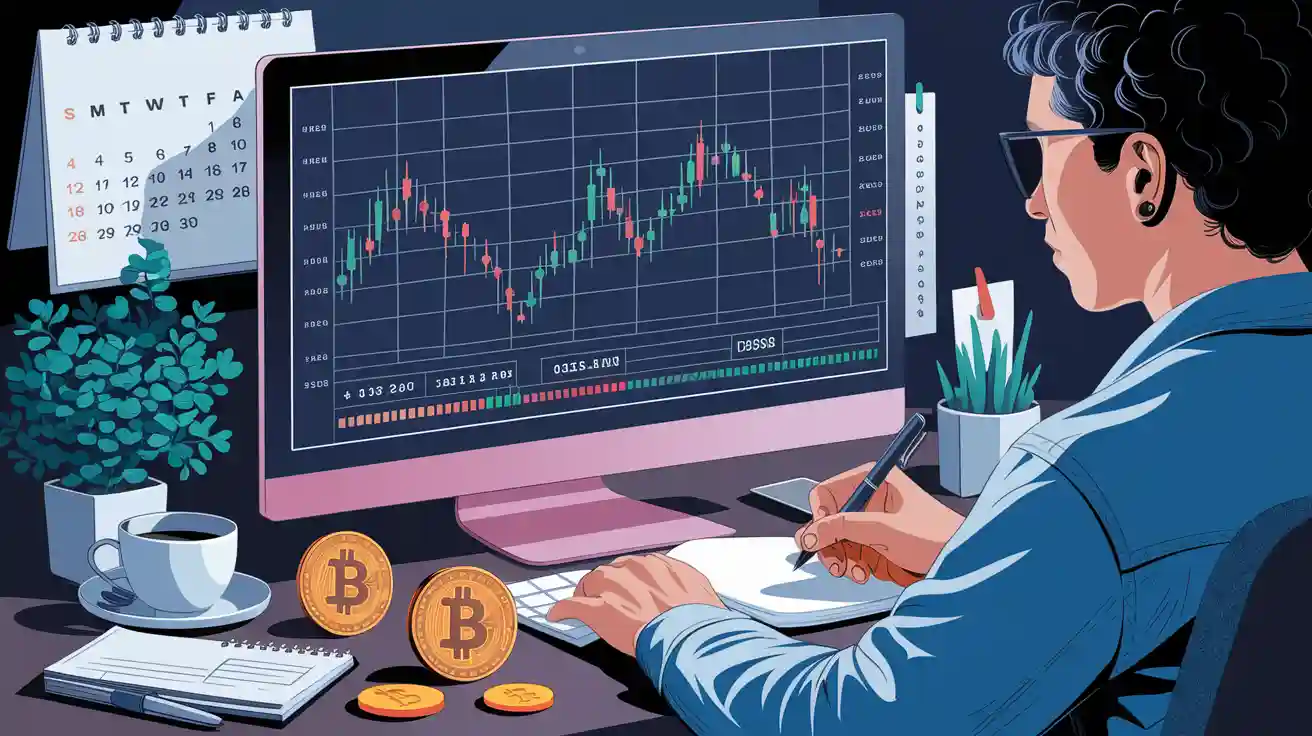
Anyone can learn how to read crypto charts with practice and the right guidance. When someone looks at cryptocurrency technical analysis charts, they might feel confused at first. He should start by learning how to read charts, focusing on simple shapes and numbers. Understanding how to read crypto charts helps a new trader spot trends and make smart choices. She should pay attention to key elements like price and volume. With these basics, anyone can master how to read crypto charts and become confident at reading crypto charts.
Key Takeaways
- Start learning crypto charts by focusing on simple chart types like line and candlestick charts to spot trends easily.
- Understand chart parts such as time, price, and volume to read price movements clearly and avoid mistakes.
- Look for trends, support and resistance levels, and common chart patterns to make smarter trading decisions.
- Use a few technical indicators like moving averages and RSI to confirm trends and find good entry or exit points.
- Practice regularly, choose reliable platforms, manage risks carefully, and keep learning to build confidence and skill.
Chart Types

Understanding different chart types helps new traders read crypto trading charts with confidence. Each chart type shows price data in a unique way. Picking the right chart can make technical analysis easier.
Line Charts
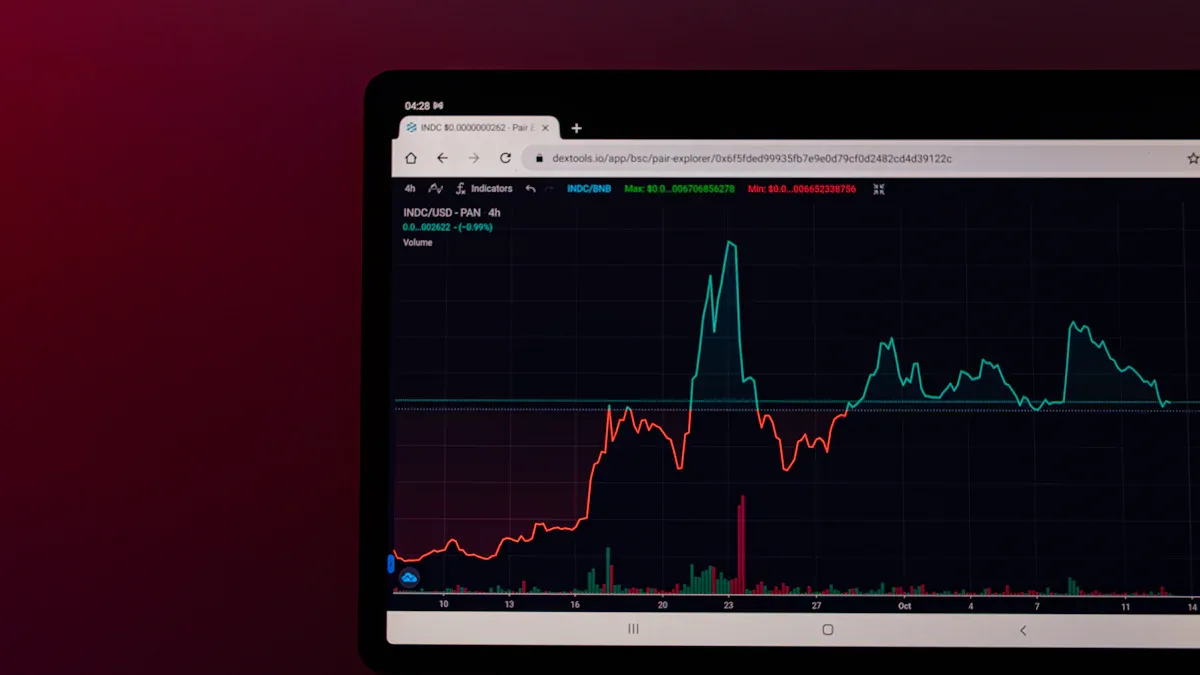
A line chart draws a simple line that connects closing prices over time. Many beginners start with a line chart because it looks clean and easy to follow. He can spot the general direction of a coin’s price. She can see if the price moves up, down, or sideways. A line chart works best for getting a quick overview of trends.
Tip: Use a line chart when you want to focus on the big picture and avoid too much detail.
Bar Charts
A bar chart gives more information than a line chart. Each bar shows the opening, closing, high, and low prices for a set time. He can see how much the price moved during that period. She can spot price changes and compare them across days or hours. Bar charts help traders who want to dig deeper into price action.
Candlestick Charts
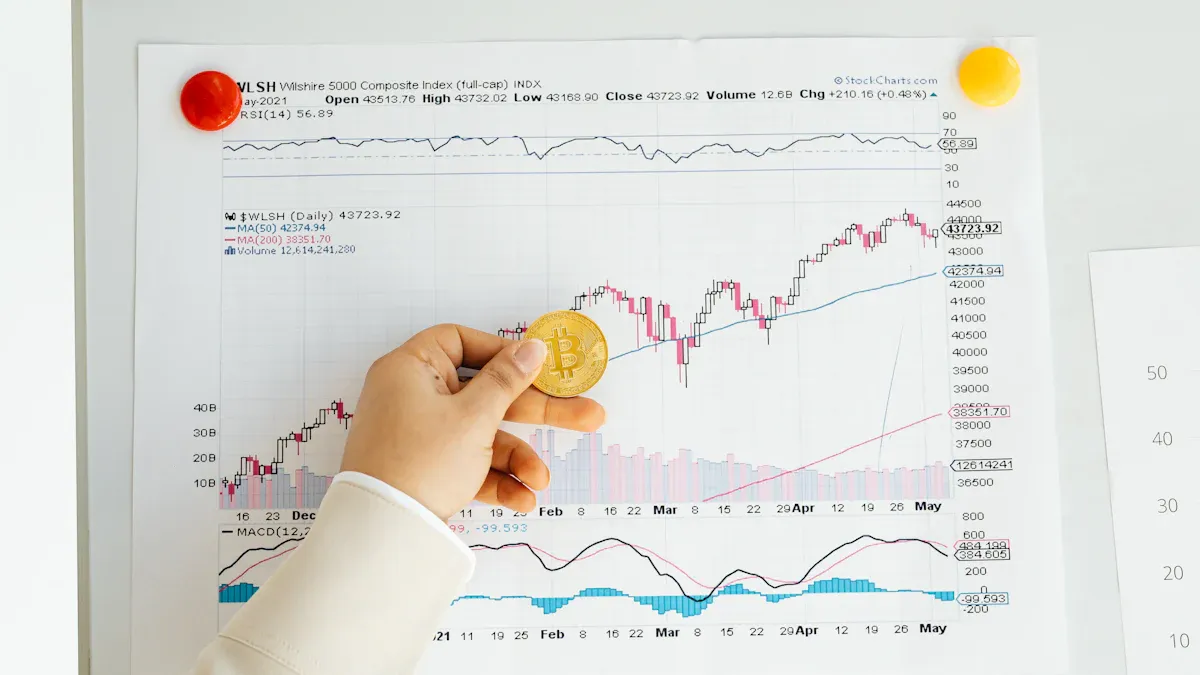
A candlestick chart is one of the most popular tools in technical analysis. Each “candle” shows the open, close, high, and low prices, just like a bar chart. The body of the candle shows if the price went up or down. Green or white candles mean the price rose. Red or black candles mean it fell. He can spot patterns and trends quickly with a candlestick chart. She can use this chart to find entry and exit points.
Note: Most traders use a candlestick chart for cryptocurrency technical analysis charts because it shows so much detail.
Heikin-Ashi Charts
Heikin-Ashi charts look like candlestick charts but use a different formula to smooth out price swings. This chart type helps traders see trends more clearly. He can spot when a trend starts or ends. She can avoid getting tricked by small price jumps. Heikin-Ashi charts work well for traders who want to ride longer trends and ignore short-term noise.
| Chart Type | Best For | Shows Details Like |
|---|---|---|
| Line Chart | Quick trend spotting | Closing price |
| Bar Chart | Deeper price analysis | Open, high, low, close |
| Candlestick Chart | Pattern recognition | Open, high, low, close, trend direction |
| Heikin-Ashi | Smoother trends | Trend strength |
Choosing the right chart type depends on what he or she wants to see. Some traders switch between chart types to get a better view. Trying different charts helps new traders find what works best for them.
Chart Anatomy
Understanding chart anatomy helps new traders unlock the secrets behind how to read crypto charts. Every chart has a few basic parts. These parts work together to show price movements and help traders make smart choices.
Axes and Price
Every chart has two main axes. The horizontal axis shows time. The vertical axis shows price. He can look at the bottom of the chart to see when price movements happened. She can check the side to see how high or low the price went. Clear labels and scales on these axes make it easier to spot trends and avoid mistakes. When the vertical axis starts at zero, it gives a true picture of price movements. Consistent scales and clear titles help traders compare different coins or time periods without confusion.
Tip: Always check the axis labels and scales before making decisions based on cryptocurrency technical analysis charts.
Timeframes
Timeframes tell traders how much data each part of the chart covers. He can choose a one-minute, one-hour, or one-day chart. She can switch timeframes to see short-term or long-term price movements. Picking the right timeframe helps traders see the bigger picture or zoom in on details. For example, a daily chart shows long-term trends, while a five-minute chart reveals quick changes. Understanding timeframes is key for anyone learning how to read crypto charts.
Volume
Volume shows how many coins traded during a certain period. It usually appears as bars at the bottom of the chart. High volume means lots of trading. Low volume means fewer trades. He can use volume to confirm if a price movement is strong or weak. She can spot when big players enter or leave the market. Volume helps traders see if a trend is real or just a quick spike. Knowing how to read crypto charts means paying close attention to volume, as it often signals the start or end of major price movements.
A clear understanding of chart anatomy—axes, timeframes, and volume—makes it much easier to read charts accurately. These elements help traders spot trends, compare assets, and avoid common mistakes. Anyone who wants to master how to read crypto charts should start by getting comfortable with these basics.
How to Read Crypto Charts
Learning how to read crypto charts can feel like solving a puzzle. New traders often wonder where to start. The best way is to follow a step-by-step process. This helps anyone spot trends, find support and resistance levels, and recognize patterns that signal trading opportunities.
Identify Trends
The first step in how to read crypto charts is to look for trends. A trend shows the general direction of price movements over time. He can see if the price moves up, down, or sideways. She can use this information to decide when to buy or sell.
- Uptrend: Prices make higher highs and higher lows. This means buyers control the market.
- Downtrend: Prices make lower highs and lower lows. Sellers have the upper hand.
- Sideways (Range-bound): Prices move within a narrow band. Neither buyers nor sellers dominate.
Moving averages help smooth out price movements. They make it easier to spot trends by reducing noise. Many traders use simple or exponential moving averages for this reason. Studies show that moving averages reveal short, medium, and long-term trends, which helps traders make better decisions.
Tip: Always check the trend direction before making any trade. Riding the trend often leads to better results.
Some advanced systems use machine learning to identify trends. For example, deep learning models can predict price movements by analyzing patterns in candlestick charts. These models often outperform basic strategies, but new traders should start with simple trend lines and moving averages.
Support and Resistance
Support and resistance levels are key parts of how to read crypto charts. Support is a price level where buyers step in and stop the price from falling. Resistance is where sellers appear and prevent the price from rising. He can use these levels to plan entry and exit points. She can spot where price movements might slow down or reverse.
- Support Level: The price bounces up from this level. It acts like a floor.
- Resistance Level: The price bounces down from this level. It acts like a ceiling.
Traders often draw horizontal lines on crypto trading charts to mark these levels. When the price breaks through support or resistance, it can signal a new trend. Many trading strategies focus on these breakouts.
Note: Support and resistance levels do not last forever. Markets change, and these levels can shift.
Research shows that clear pattern identification helps reduce false signals. Machine learning systems that separate pattern recognition from other tools make fewer mistakes. This highlights the importance of spotting support and resistance levels accurately.
Chart Patterns
Recognizing chart patterns is a big part of how to read crypto charts. Patterns show up when price movements form shapes that repeat over time. He can use these patterns to predict what might happen next. She can spot trading opportunities by watching for these signals.
Some of the most common patterns include:
- Head and Shoulders: This pattern signals a trend reversal. It looks like three peaks, with the middle one higher than the others.
- Triangles: These include ascending, descending, and symmetrical triangles. Triangles show that price movements are getting tighter. When the price breaks out, it often moves quickly. For example, in a descending triangle, traders calculate the price target by subtracting the height of the base from the breakdown point.
- Flags and Pennants: These patterns appear after a strong price move. They look like small rectangles or triangles. When the price breaks out, it usually continues in the same direction.
- Double and Triple Tops/Bottoms: These patterns signal that a trend might end soon. The price tests the same level two or three times before reversing.
| Pattern Name | What It Signals | How to Spot It |
|---|---|---|
| Head and Shoulders | Trend reversal | Three peaks, middle highest |
| Ascending Triangle | Bullish continuation | Flat top, rising bottom |
| Descending Triangle | Bearish continuation | Flat bottom, falling top |
| Symmetrical Triangle | Uncertain breakout | Converging trendlines |
| Flag/Pennant | Continuation | Small pause after big move |
| Double Top/Bottom | Reversal | Two peaks or valleys |
Pattern recognition is not always easy. Studies show that even advanced machine learning models can struggle with accuracy. For example, some models have high classification accuracy but low F1 scores, which means they miss important signals. Other research found that candlestick patterns alone do not always lead to profits after transaction costs. This means traders should use patterns as one part of their crypto chart analysis, not the only tool.
Tip: Combine chart patterns with support and resistance levels for stronger signals. This helps filter out false alarms and improves trading opportunities.
Learning how to read crypto charts takes practice. He should start by choosing a chart type, setting the right timeframe, and looking for trends. She can then mark support and resistance levels and watch for patterns. By following these steps, anyone can get better at reading crypto charts and analyzing price movements.
Technical Indicators

New traders often hear about technical indicators when they start using cryptocurrency technical analysis charts. These tools help traders make sense of price movements and spot trading opportunities. By adding technical indicators to a candlestick chart, anyone can see trends, momentum, and possible turning points.
Moving Averages
Moving averages show the average price over a set period. They smooth out price changes and help traders see the main trend. He can use a simple moving average (SMA) or an exponential moving average (EMA). The EMA reacts faster to price changes. Many traders add a moving average to a candlestick chart to spot uptrends or downtrends. When the price stays above the moving average, the trend is usually up.
Tip: Try using two moving averages with different periods. When they cross, it can signal a change in trend.
RSI
RSI stands for Relative Strength Index. This technical indicator measures how fast and how much the price moves. It ranges from 0 to 100. If the RSI goes above 70, the coin might be overbought. If it drops below 30, it could be oversold. She can use RSI to decide if a coin is too expensive or too cheap. RSI works well with other technical analysis tools.
MACD
MACD means Moving Average Convergence Divergence. This technical indicator compares two moving averages. It shows when trends might start or end. He can look for the MACD line crossing above or below the signal line. A crossover often means a new trend is coming. MACD works best on a candlestick chart with clear price swings.
Bollinger Bands
Bollinger Bands use a moving average and two lines above and below it. These bands show how much the price moves up or down. When the bands get close together, the price might break out soon. When the price touches the top band, it could be too high. If it hits the bottom band, it might be too low. She can use Bollinger Bands to spot times when the market is calm or ready to move.
Note: Beginners should start by adding one or two technical indicators to their charts. Too many can cause confusion.
| Indicator | What It Shows | How It Helps Traders |
|---|---|---|
| Moving Average | Trend direction | Spots uptrends and downtrends |
| RSI | Overbought/oversold | Finds entry and exit points |
| MACD | Trend changes | Signals new trends |
| Bollinger Bands | Price volatility | Spots breakouts and reversals |
Learning to use technical indicators makes technical analysis easier. With practice, anyone can use these tools to make better trading choices on cryptocurrency technical analysis charts.
Practical Tips
Choosing Platforms
He should start by picking a reliable trading platform. Many new traders feel lost with so many choices. She can look for platforms that offer clear charts, easy navigation, and strong security. Some platforms let users try demo accounts. These accounts help beginners practice how to read crypto charts without risking real money. He can focus on coins with high trading volume. High-liquidity coins make it easier to spot price movements and enter or exit trades. She should check if the platform offers tools for technical analysis. Good charting tools help traders find trading opportunities and learn faster.
Tip: Always test a platform with a demo account before trading real money.
Risk Management
He needs a plan to protect his money. She can set stop-loss orders to limit losses if price movements go the wrong way. Many traders risk only a small part of their account on each trade. This keeps losses small and helps them stay in the game longer. He should avoid chasing losses or making big bets after a loss. She can use technical analysis to plan trades and manage risk. Learning how to read crypto charts helps traders spot warning signs and avoid big mistakes.
| Risk Management Tip | Why It Matters |
|---|---|
| Use stop-loss orders | Limits losses on bad trades |
| Risk small amounts | Protects trading account |
| Stick to your plan | Avoids emotional decisions |
Common Mistakes
Many beginners make the same errors when learning how to read crypto charts. He might use too many indicators at once. This can make charts confusing and hard to read. She may ignore volume or focus only on price movements. Some traders forget to check different timeframes. This can lead to missed signals or bad timing. He should not trade based only on one pattern or signal. She can combine technical analysis with other research for better results.
Note: Practice and patience help traders get better at how to read crypto charts. Mistakes are part of the learning process.
Reading cryptocurrency technical analysis charts gets easier with practice. He or she can start by picking a chart type, checking trends, and spotting patterns. Patience helps new traders build skill and confidence.
- Try analyzing real charts every day.
- Join trading groups to learn from others.
- Explore advanced tools when ready.
Remember: Every expert started as a beginner. Keep learning and stay curious!
FAQ
How does someone choose the best chart type for crypto trading?
He or she should start with candlestick charts. These show the most detail. If the chart looks confusing, try a line chart for a simple view. Switching between chart types helps traders find what works best.
Can a beginner use technical indicators right away?
Yes! Beginners can add one or two indicators, like moving averages or RSI. He should avoid using too many at once. Simple setups help new traders learn faster and spot trends more easily.
Why do timeframes matter in crypto charts?
Timeframes show how much data each part of the chart covers. She can use short timeframes for quick trades. He can use longer timeframes to see big trends. Picking the right timeframe helps traders match their style.
What is the most common mistake new traders make?
Many new traders use too many indicators or ignore volume. He might forget to check different timeframes. She may trade based on one signal. Keeping things simple and practicing often helps avoid these mistakes.
Do chart patterns always predict price moves?
No, chart patterns do not always work. He should use patterns with other tools, like support and resistance. She can practice spotting patterns, but no method gives perfect results. Always manage risk and stay patient.
Tip: Practice reading real charts every day. This builds skill and confidence!