FameEX Daily Market Trend | Extreme Fear Dominates as BTC Fails to Break $92K and Market Structure Compresses
2025-12-09 07:59:59
As the Fear & Greed Index has remained in the “Extreme Fear” zone for several consecutive weeks, BTC briefly pushed above $92,250 before quickly retracing toward around $90K. Underscoring that, against a backdrop of macro uncertainty and a fragile leverage structure, the recent rebound still amounts to structural repair rather than the start of a new trend. At the same time, total market liquidations exceeded 200 million dollars over 24 hours, with short sellers continuing to battle between dense sell orders above spot and concentrated liquidation liquidity, while the absence of clear incremental inflows into ETFs and the discount of USDT in the Chinese market further suppresses risk appetite. By contrast, on the regulatory front, the CFTC’s pilot program for tokenized collateral, along with compliant RWA L1s and AI-focused L1 ecosystems, is creating new focal points for medium to long-term capital allocation narratives.
1. Market Summary
- The Fear & Greed Index rebounded to 22 today but remains in “Extreme Fear,” having hovered between 20–23 multiple times over the past week and the past month, indicating depressed sentiment with marginal improvement.
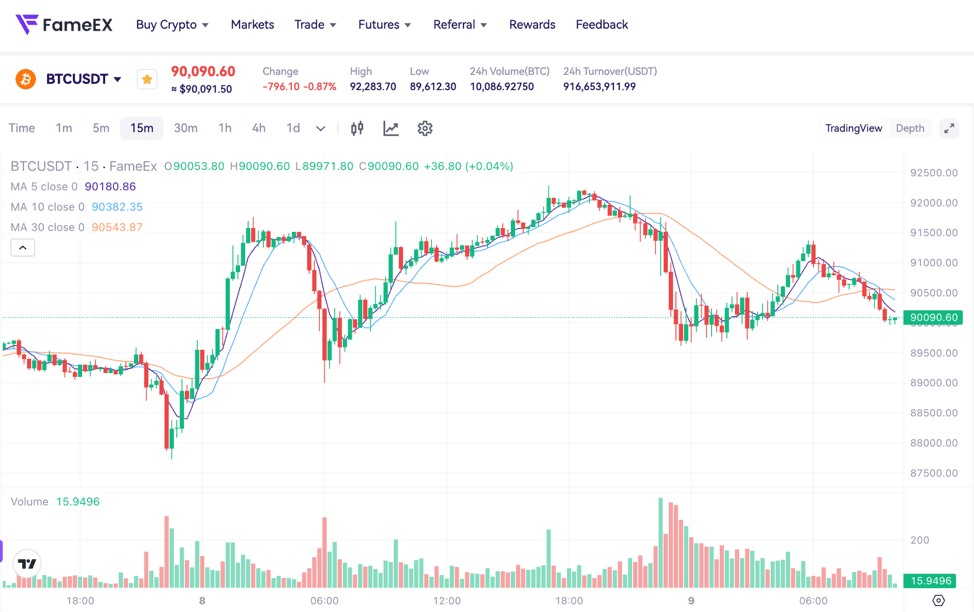
- BTC has repeatedly met resistance at the upper end of the $92K–$93K range due to heavy selling pressure, pulling back in the short term to around $90K. The 3-month futures annualized basis has stayed below the neutral 5% threshold for two consecutive weeks, pointing to weak demand for leveraged longs.
- Over the past 24 hours, total market liquidations reached about $202.06M across 84,564 traders, including roughly $64.44M in BTC and $52.00M in ETH liquidations, with long and short liquidation sizes broadly comparable. This reflects frequent two-sided leverage washouts within the range.
- Spot BTC ETFs continue to see a lack of meaningful net inflows, while hedge funds and institutions prefer to purchase downside protection via options. The sharply higher cost of protective puts in derivatives markets shows that professional capital remains highly sensitive to short-term drawdown risk.
- On the macro side, CME interest-rate futures pricing implies an approximately 89% probability of a 25bp rate cut by the Federal Reserve in December, but delays in official employment and inflation data, combined with a weak US housing market and a modest rebound in the dollar index, continue to weigh on risk appetite across risk assets.
2. Market Sentiment & Emotion Indicators
The Fear & Greed Index currently stands at 22, extending its stay in the “Extreme Fear” zone and broadly in line with yesterday’s 20, last week’s 23, and last month’s 22. This suggests that while sentiment has improved slightly at the margin, it remains far from exiting a fearful regime. Following an approximate 28% pullback from the all-time high in October, BTC has spent an extended period oscillating between $80K–$90K, allowing investors to grow more accustomed to the drawdown. As a result, the index has not made new lows, yet it still reflects strong demand for hedging and a slower pace of risk capital deployment. The current structure resembles a prolonged digestion phase after a deep correction rather than a classic V-shaped reversal driven by capitulation and an immediate sentiment inflection.
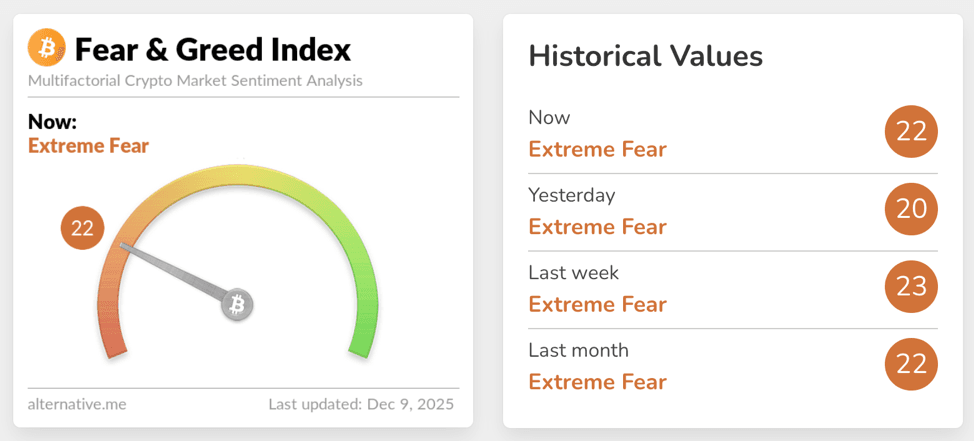
Source: Alternative
From the perspective of aggregate liquidations and leverage structure, total market liquidations over the past 24 hours amounted to about $202.06M. Higher-timeframe data show that 12-hour liquidations have already reached $118.13M, while the 1-hour and 4-hour windows saw around $9.14M and $16.74M respectively, indicating that in a narrow trading range, short-tenor leverage is particularly prone to being “swept out.” The liquidation profile is relatively balanced between longs and shorts: over 24 hours, long liquidations were roughly $96.08M and short liquidations about $105.98M, with BTC and ETH accounting for approximately $64.44M and $52.00M respectively. This damage on both sides of the liquidation pattern suggests that the market has not formed a one-sided squeeze in the short term. Instead, it resembles high-frequency leverage rebalancing in a thin-liquidity environment where large orders and macro headlines interact.
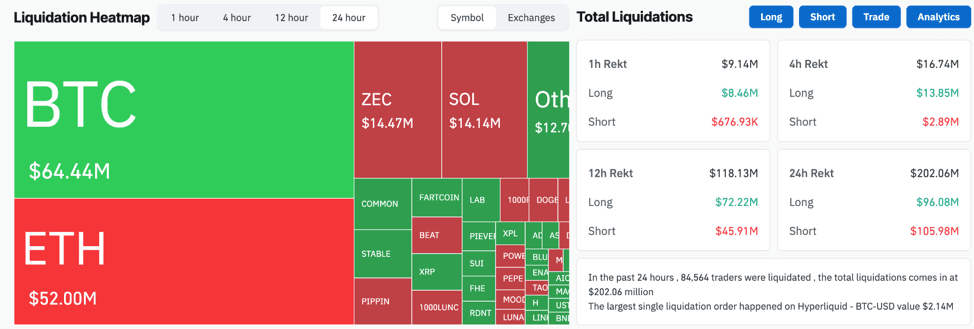
Source: Coinglass
On the macro and regulatory fronts, the structure is framed by medium to long-term factors. On one hand, the 43-day government shutdown has delayed the release of official US employment and inflation data, reducing economic visibility in the coming months. Even though markets broadly expect a 25bp rate cut in December, this has yet to translate into trend-driven buying across risk assets. In housing data, the share of cancelled home purchase agreements has risen to 15%, and listing prices in some cities have edged lower year-on-year, highlighting that pressures in the real economy have not been fully resolved. On the other hand, the US CFTC has launched a pilot program allowing approved futures commission merchants to accept BTC, ETH and USDC as margin collateral, while also updating guidance on tokenized assets and withdrawing outdated restrictive rules. This move is expected to improve the regulatory standing of crypto assets in traditional derivatives markets over the medium to long term. Together with the ongoing expansion of RWA-focused L1s and the stablecoin ecosystem. For example, PYUSD circulation has risen to 3.8 billion dollars since September. The overall structure presents a mismatch in which short-term macro pressures remain elevated while the institutional foundation strengthens gradually over the long run.
3. BTC & ETH Technical Data
3.1 BTC Market
BTC has repeatedly attempted to break above the upper boundary of the $92K–$93K range, with recent highs around $92,250 before retracing to approximately $90K. This roughly $2,650 short-term correction has closely tracked pullbacks in US equities and mounting concerns over stretched valuations in AI-related stocks, underscoring BTC’s deep integration into the broader global risk-asset complex. From a futures-structure perspective, the annualized basis on 3-month BTC futures versus spot has stayed below 5% for two consecutive weeks, well under the 10%–15% optimistic range typically seen in strong bull markets, indicating that leveraged longs are more inclined to wait on the sidelines rather than aggressively add exposure. In the options market, on a major derivatives platform, 30-day BTC put options are trading at roughly a 13% premium to calls, with investors willing to pay a significant premium to hedge downside risk. This configuration is characteristic of a mid-cycle correction in which the spot has not fully broken down but investors remain highly sensitive to tail-risk scenarios.
From the standpoint of liquidity and order-book distribution, cumulative volume data show that net traded volume is in the 0–100 BTC bucket. This is more closely associated with retail and smaller institutions, which have been gradually rising over the past two weeks, suggesting that some dip-buying has been taking place across the $80K–$90K band. By contrast, larger players in the 1,000–100,000 BTC and 100,000–1,000,000 BTC cohorts have tended to reduce exposure to strength within the $90K–$93K region, creating a layered buying below distribution above range-trading regime. Order-book data from a major CEX for BTC perpetual swaps corroborate this picture that a sell wall has gradually formed above $90K, with particularly dense offers clustered in the $94K–$95K zone. At the same time, liquidation heatmaps indicate significant short liquidation liquidity accumulated between $94K–$95,300. If a short-term upside move is triggered, this area could become fuel for a short squeeze, but only if there is a clear incremental spot or futures buying. It is also worth noting that in the Chinese OTC market, USDT/CNY is trading at a discount versus the official exchange rate. Under neutral conditions, USDT should trade at a 0.2%–1% premium to compensate for cross-border frictions and regulatory costs. A discount instead signals that local investors are inclined to exit crypto markets in favor of fiat assets, adding further pressure to the short-term structure.
3.2 ETH Market
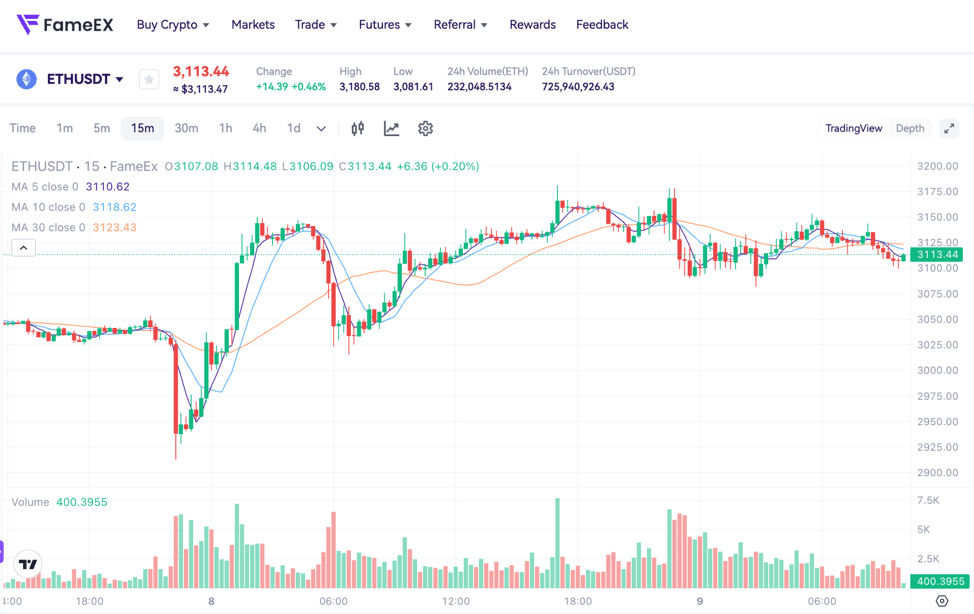
ETH is influenced both by overall risk sentiment and BTC’s range-bound behavior, as well as by its own increasingly differentiated narrative. On one hand, the US CFTC has included ETH among the assets eligible to be used as collateral in derivatives markets, alongside BTC and USDC, as part of its pilot program. This development should enhance ETH’s capital efficiency in regulated venues going forward and reinforce its dual role as a settlement-layer asset and collateral. On the other hand, although spot ETH ETFs have been approved, the market is still awaiting further progress on products linked to staking yield, L2 scaling, and newer vehicles such as ETFs tied directly to staking income. From an on-chain and institutional positioning angle, the Ethereum treasury company Bitmine recently accumulated 138,452 ETH at an average cost of about $2,978 (roughly 412 million dollars), bringing its total holdings to 3,864,951 ETH (about 12.074 billion dollars). However, its average cost basis stands near $3,925, leaving it with an unrealized loss of roughly 3.095 billion. This structure both underscores long-term institutional conviction in ETH’s medium- to long-term value and suggests that, should prices once again approach the firm’s cost range, some risk-management actions could be triggered.
In terms of futures and leverage, recent ETH open interest (OI) remains compressed after a pronounced deleveraging phase in the previous weeks, while funding rates have mostly oscillated around slightly positive or negative levels, indicating that leveraged longs and shorts have yet to establish a clear directional bias. Compared with BTC, ETH is more readily driven by overlapping narratives, including staking yield, L2 ecosystem growth, DeFi activity and the rollout of new RWA and tokenization products. For example, BlackRock has recently filed in the US to launch an ETF tied to staked ETH. If approved, this would create a new compliant capital entry point for ETH and could accelerate the concentration of capital around the “staking + L2 scaling” theme. In the short term, given BTC’s range-bound trading and elevated macro uncertainty, ETH is likely to remain in a regime characterized by structural repair and narrative rotation rather than a standalone, strong directional trend.
4. Trending Tokens
- NEO (Neo)
As a public chain focused on the vision of a smart economy, NEO has recently regained market attention through its collaboration with SpoonOS to launch the Scoop AI Hackathon. This global hackathon, spanning multiple cities across Asia, Europe and the Americas and offering a total prize pool of about $100,000, brings together Web3 and AI developers on a single stage to build applications around an intelligent and sentient economy, reinforcing NEO’s narrative positioning at the intersection of AI and blockchain. For NEO, this is not only an opportunity to mobilize its developer community and sharpen its brand focus, but also a chance to expand usage of its core infrastructure, such as decentralized storage, oracles, and domain services. As the Scoop AI Hackathon rolls through Moscow, Hanoi, Tokyo, Seoul, Silicon Valley, Bangalore, Beijing and London, if it succeeds in incubating AI agents, data marketplaces and intelligent protocols with real-world adoption potential, the valuation framework for NEO within the next wave of AI-plus-L1 competition could be meaningfully re-rated.
- OM (MANTRA)
OM is the core token of the MANTRA ecosystem, whose MANTRA Chain aims to become the first RWA-dedicated L1 capable of natively adhering to and enforcing real-world regulatory requirements. Against the backdrop of the narrative that tokenization is a near-quadrillion-dollar opportunity, unlocking roughly 16 trillion dollars of RWA, OM has once again attracted capital attention. The chain’s design focuses on providing public-chain infrastructure that traditional financial institutions can adopt in a compliant manner, using regulatory frameworks, whitelisting mechanisms and tokenization toolkits to enable banks, brokers and asset managers to map bonds, real estate, funds and notes onto the blockchain seamlessly. For OM, as on-chain RWA issuance scales up, demand for staking, fee payments and governance rights is likely to rise in tandem, creating a positive loop between regulation-friendly architecture and real-asset inflows. As the market digests macro uncertainty and the pace of regulatory implementation, the compliant RWA infrastructure narrative represented by OM may become an important allocation vector for some medium- to long-term investors seeking diversification away from BTC and ETH volatility.
- ARKM (Arkham)
ARKM sits in the on-chain data and intelligence infrastructure segment, with its platform focused on structuring and visualizing what would otherwise be highly fragmented address activity, capital flows and real-world entity information across crypto markets, thereby providing more granular risk-identification tools for institutional investors, compliance teams and professional traders. Recently, Arkham launched a mobile application for its exchange platform, clearly aiming to broaden user reach and deepen trading activity by integrating on-chain intelligence and trade execution into a single closed loop. From a business-model perspective, as more capital comes to rely on on-chain intelligence for risk management and portfolio allocation, demand for ARKM as the platform’s native token is expected to grow accordingly. ARKM is used for fee discounts, feature unlocks and governance. At the same time, the platform has already raised more than 12 million dollars in funding, providing ongoing fuel for product iteration and market expansion. While the broader market remains in a phase of risk re-pricing, assets like ARKM, which underpin core data and intelligence infrastructure, tend to be more attractive to long-term capital with a relatively defensive tilt.
5. Today Token Unlocks
- $GMT: Unlocking 82.47 million tokens, with 2.81% of the circulating supply as the largest unlock today.
- $MOVE: Unlocking 50.00 million tokens, with 1.79% of circulating supply.
6. Conclusion
Overall, the market remains in an intermediate phase characterized by significant structural price adjustment, persistent Extreme Fear and macro uncertainty weighing on risk appetite. BTC faces overhead supply and dense short-liquidation liquidity in the $90K–$93K band. This is making it difficult to immediately reignite a trend-driven bull leg, although medium to long-term capital has gradually begun to accumulate in tranches within the $80K–$90K range. Even though ETH is supported by the CFTC collateral pilot and the staking narrative, ETH continues along a relatively orderly structural repair path. But large treasury positions remain deeply underwater, limiting its ability to decouple from BTC’s broader risk framework in the short term. At the narrative level, themes such as RWA, AI-focused L1s and on-chain intelligence infrastructure are attracting selective rotation flows and providing new medium- to long-term valuation anchors. Until Federal Reserve policy, labor-market data and housing indicators become clearer, the overall setup still resembles an extended process of leverage and position rebalancing. Strategically, market participants should prioritize strict leverage control and careful monitoring of liquidity depth, while patiently waiting for more definitive signals from macro conditions and capital flows before positioning for the next major trend.
Disclaimer: The information provided in this section is for reference only and does not represent any investment advice or the official views of FameEX.