FameEX Daily Market Trend | BTC Stuck in Range as Markets Price FOMC Cuts
2025-12-02 07:17:44
With the Fear & Greed Index sliding back to 23 and remaining in the “Extreme Fear” zone for multiple consecutive days, the crypto market continues to trade in a post-correction range-bound structure. BTC is oscillating between an on-chain cost-support band at $80,600–$84,000 and an overhead resistance zone at $93,000–$96,000, with price momentum heavily dependent on fragile spot liquidity and highly sensitive leveraged positioning. At the same time, markets are intensely focused on the December FOMC meeting and the path of rate cuts. Large traditional asset managers and BTC-heavy listed companies are adjusting exposure via ETF products and their own balance sheets, reinforcing a regime of sideways price action and structural repricing rather than a straightforward trend reversal.
1. Market Summary
- The Fear & Greed Index fell to 23 today, down 1 point from yesterday, remaining in “Extreme Fear” territory and signaling that investor risk appetite is still defensive and in wait-and-see mode.
- Over the past 24 hours, total liquidations across the market reached roughly 588 million dollars, including about 460 million dollars in long liquidations and 127 million dollars in short liquidations. This indicates that the leverage structure is still dominated by long-side deleveraging and that the broader deleveraging process is not yet complete.
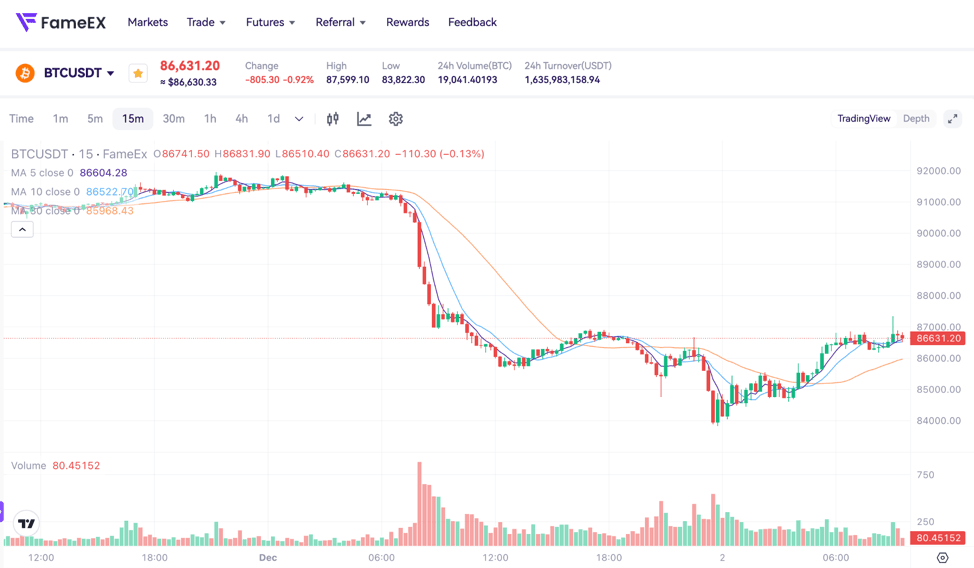
- BTC is trading between an on-chain cost-support zone around $80,600–$84,000 and an upper resistance band at $93,000–$96,000. Spot buying momentum remains limited, and near-term price action is skewed toward range rotation and liquidity sweeps rather than a unilateral trend.
- On the macro side, CME FedWatch data shows an approximately 87.6% probability of a 25 bps rate cut in December, with markets broadly expecting a mild easing cycle over the coming months. This supports a recalibration of discount rates for risk assets over the medium term, but in the short run conditions are still constrained by tightening liquidity and a gradual repair in confidence.
- On the institutional front, a BTC listed company has increased its BTC holdings to around 650,000 coins while establishing roughly 1.44 billion dollars in cash reserves to fund dividends and interest payments. Large traditional asset managers have opened up crypto ETF trading for clients, and a spot ETF tracking Chainlink is set to list on a U.S. exchange, underscoring the continued expansion of traditional finance toolkits for allocating to digital assets.
2. Market Sentiment / Emotion Indicators
From a sentiment standpoint, the Fear & Greed Index dropping to 23 and remaining in “Extreme Fear” territory for several consecutive days is comparable to readings seen during past episodes of sharp market pullbacks and excessive pessimism. Such extreme readings typically indicate that the dominant market narrative has shifted from chasing high-beta assets and leveraged returns to capital preservation and cash flow security. Investors increasingly prefer cash, stablecoins, or highly liquid large-cap assets as safe havens. In this environment, short-term traders often choose to reduce risk first and wait for clearer direction, leading to thinner spot volumes and shallower order-book depth. When one-sided selling or liquidation events occur under these conditions, price swings are easily amplified, resulting in a structural pattern of low liquidity magnifying volatility.
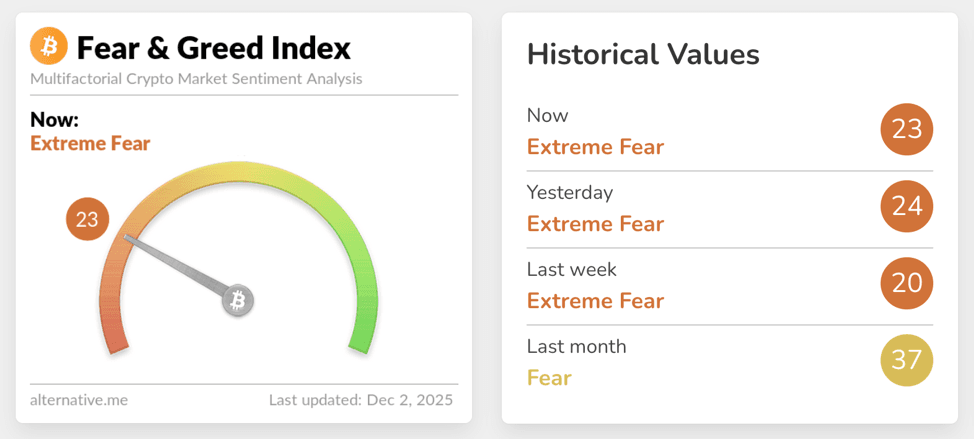
Source: Alternative
Leverage and liquidation data show that the market remains in an ongoing deleveraging phase. Over the past 24 hours, total liquidations reached roughly 588 million dollars, with about 460 million dollars in long liquidations and 127 million dollars in short liquidations, suggesting that the leveraged long positions accumulated at higher levels are still being passively unwound. Approximately 225 million dollars in BTC longs were liquidated, while about 97 million dollars in ETH longs were flushed out, indicating that every test of the lower end of the range continues to trigger margin shortfalls or late stop-losses among leveraged longs. This staggered long wipeout process suppresses short-term upside momentum while gradually compressing overall leverage in derivatives markets, paving the way for a healthier upside structure later on.
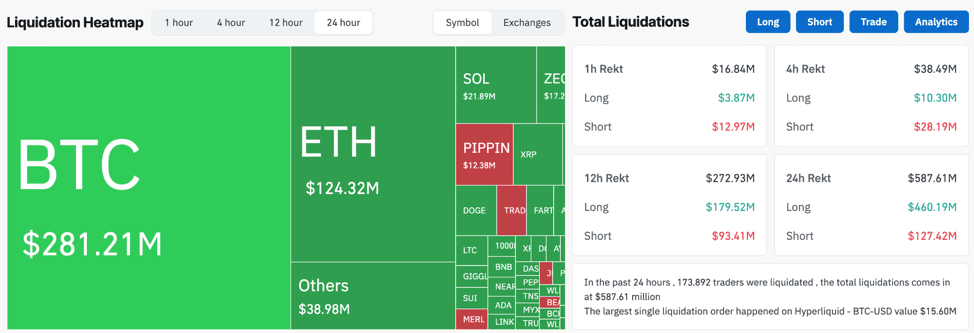
Source: Coinglass
The macro and regulatory background provides the framework for today’s price-structure rebalancing. CME tools indicate that market expectations for a 25 bps rate cut at the December FOMC meeting are approaching 90%, with additional cumulative cuts by early next year still viewed as possible. This is easing pressure on long-end yields and risk-asset discount rates, supporting a medium to long-term repricing of risk assets. Simultaneously, U.S. lawmakers are advancing digital asset market-structure legislation in an effort to provide banks and crypto firms with a clearer regulatory path. Traditional asset-management giants are enabling crypto ETF trading, Bitcoin-linked ETF products are expanding, and a major CEX has secured key state-level regulatory approval. Therefore, these developments suggest a gradual shift in the regulatory regime from ambiguous oversight and selective enforcement toward clear rules and large-scale institutional participation. However, in terms of actual capital allocation, the market remains in a transitional phase of waiting for macro catalysts to materialize while cleaning up legacy leverage, making a rapid turn to optimism in sentiment and structure unlikely in the short term.
3. BTC & ETH Technical Data
3.1 BTC Market
From a structural perspective, after roughly a 30% pullback from its October all-time high, BTC is now primarily oscillating between an on-chain cost-support zone at $80,600–$84,000 and an overhead resistance band at $93,000–$96,000. The former corresponds to heavy historical positioning and cost bases, while the latter coincides with technical resistance and dense liquidation clusters. Thin spot depth and a lack of aggressive spot buying have meant that each attempt by BTC to sustain a breakout above $93,000 has lacked sufficient volume confirmation, with price often reverting back to the middle or lower parts of the range after touching the upper band. Meanwhile, the ratio of stablecoin reserves to BTC on exchanges is at an extreme level, implying a substantial amount of not deployed holdings in stablecoins that could support future upside. Yet with sentiment still fragile and key macro events approaching, this latent buy-side firepower remains largely sidelined. On the derivatives side, after multiple waves of large long liquidations, open interest (OI) has retreated from its highs, and funding rates around major venues are oscillating near mildly positive or slightly negative levels. This indicates limited appetite for chasing high leverage on the long side and a broader defensive posture focused on reducing leverage and preserving optionality. Overall, unless a clear macro catalyst emerges or spot demand returns meaningfully, BTC is more likely in the near term to continue rotating within this established range, repeatedly sweeping liquidity while awaiting clearer guidance on rates and liquidity from the FOMC.
3.2 ETH Market
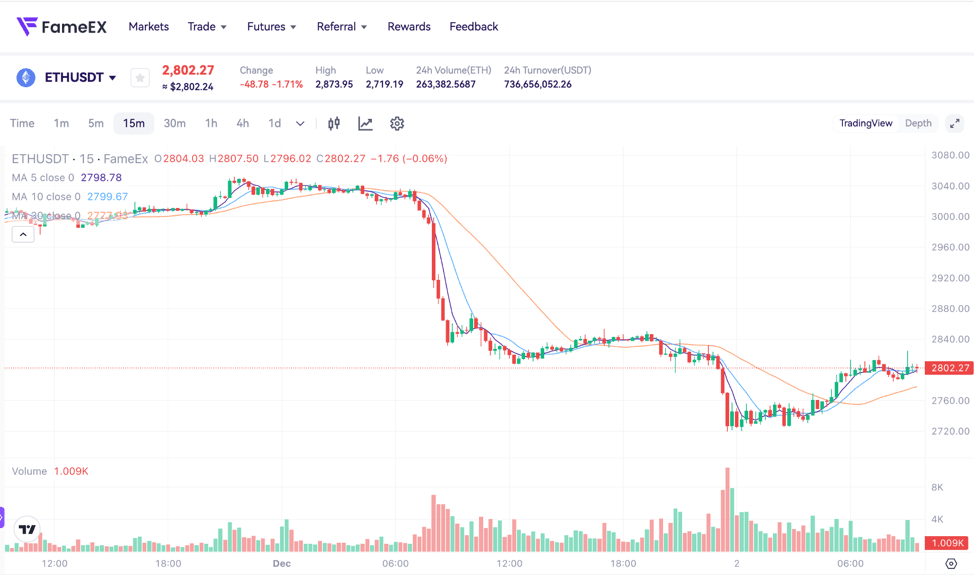
In this leg of the correction, ETH has declined more sharply than BTC, with prices falling by more than 30% over the past two months. This reflects the market’s stronger adjustment pressure on high-beta and high-leverage assets during periods of declining risk appetite. However, on-chain and institutional positioning sends a signal partially at odds with the price action. A large mining and infrastructure-linked institution has accumulated more than 1.075 million ETH over the past two months and added nearly another 100,000 ETH last week even as prices continued to drift lower, bringing its total holdings to roughly 3.72 million ETH. This points to persistent buy-the-dip behavior from medium to long-term traders. In derivatives, ETH perpetual funding rates, which were previously positive, have at times moved toward flat or briefly negative during periods of heightened volatility, while open interest has also retreated from elevated levels indicating that a portion of the previously crowded leveraged long positions has been flushed out. From a technical perspective, ETH is attempting to build a secondary bottom structure near the lower boundary of its prior trading range. In the short term, it may still follow BTC in probing lower-liquidity areas, but if the anticipated macro rate-cut cycle materializes and narratives around L2 ecosystems, restaking, and ETH yield regain market attention, ETH could see a structurally stronger recovery relative to BTC as leverage resets and positioning becomes more concentrated.
4. Trending Tokens
- HYPE (Hyperliquid)
The HYPE token sits at the core of the Hyperliquid ecosystem, whose main narrative is building a high-performance L1 and fully on-chain perpetual infrastructure. Its flagship application, Hyperliquid DEX, routes order-book matching, order placement, trade execution, and liquidation entirely on-chain, delivering depth and latency close to that of centralized exchanges while keeping block latency under 1 second. Recently, the launch of governance token $KNTQ and its native trading pair with USDH on Hyperliquid that combined with seamless transfers between HyperCore and HyperEVM has strengthened capital efficiency and cross-domain liquidity. This further consolidates HYPE’s role as a foundational settlement and risk-bearing asset. Against a macro backdrop of ongoing deleveraging, the market’s appreciation for fully on-chain derivatives and transparent liquidation mechanisms is rising, which structurally favors L1 narratives built around performance and transparency. For traders, HYPE’s trading structure and liquidity remain highly sensitive to perpetual volume and market-making capital dynamics, implying potentially elevated short-term volatility.
- ASTER (ASTER)
ASTER is positioned around the narrative of next-generation decentralized perpetual exchanges, aiming to strike a balance between one-click trading, on-chain depth, and automated strategies to deliver an experience for professional and semi-professional traders that more closely resembles traditional futures platforms. Its recently launched Double Harvest Phase 3 campaign from December 1 to 7 is designed with a clear emphasis on real risk-taking and substantive trading volume. If perpetual depth and active trading volumes increase meaningfully over the course of the campaign, the ASTER-related token complex could demonstrate relative resilience in today’s tight-liquidity environment and attract capital focused on DeFi derivatives narratives to reassess its valuation range.
- SOMI (Somnia Network)
SOMI underpins the Somnia Network, which is positioned as an L1 blockchain and full-stack set of protocols connecting multiple metaverses and virtual societies. Its core focus is on portable and composable NFT standards that allow content and identities to move freely across different virtual worlds. The recently introduced Somnia Data Streams technology aims to bring Web2-grade database latency and scalability into Web3 applications, enabling developers to achieve near-real-time backend performance while preserving on-chain verification and data persistence. By reducing the need for constant wallet signatures via session authorization, replacing polling with push updates, and providing built-in data structures and indexing, Somnia targets the structural pain points of traditional on-chain applications which is namely high latency, fragmented user experience, and elevated development costs. In a macro environment where overall risk appetite is suppressed, purely narrative-driven metaverse and gaming tokens tend to struggle to attract sustained inflows. However, infrastructure plays like SOMI, which combine foundational performance upgrades with cross-application interoperability, may still draw medium to long-term capital if they can demonstrate the ability to support high concurrency and large user bases.
5. Today Token Unlocks
- $ENA: 110.95 million tokens unlocked, with around 1.49% of circulating supply.
6. Conclusion
Today’s market structure remains defined by price structural rebalancing under Extreme Fear. On one hand, the Fear & Greed Index sits at 23 in the Extreme Fear zone, with roughly 588 million dollars in total liquidations over the past 24 hours skewed toward long-side deleveraging. This highlights the ongoing unwinding of high-leverage long positions built up in prior months, while thin spot volumes and shallow order-book depth continue to magnify each price swing. On the other hand, BTC is oscillating between the $80,600–$84,000 on-chain cost band and the $93,000–$96,000 resistance zone, while ETH is gradually shaping a structural bottom after a steeper drawdown, supported by incremental institutional accumulation and a cleaner derivatives profile. At the macro level, a high probability of a December rate cut and the progression of digital asset market-structure legislation together reinforce a dual narrative of long-term institutionalization, near-term deleveraging. Coupled with narratives around fully on-chain derivatives, high-performance infrastructure, and virtual-society rail builders such as HYPE, ASTER, and SOMI, the overall market looks more like it is pre-emptively cleaning up leverage and repositioning for the next trend leg, rather than extending a simple one-sided bear market. In this environment, traders should prioritize risk management and structural diagnostics, focusing on leverage ratios, spot depth, and the timing of macro catalysts, and wait for a synchronized improvement in sentiment and liquidity before meaningfully increasing risk exposure.
Disclaimer: The information provided in this section is for reference only and does not represent any investment advice or the official views of FameEX.