FameEX Today’s Crypto News Recap | June 10, 2026
2026-06-10 06:20:41

MiCA architect urges RWA priority, BTC mimics bear patterns, and World Cup predictions top $1.8B. Under macro inflation fears, the crypto market saw $406M liquidated as BTC broke below $62K and ETH tested $1.5K. Ahead of the release of key U.S. inflation data, macro uncertainty has once again weighed on global financial markets. The market broadly expects the Federal Reserve to keep interest rates higher for longer. U.S. Treasury yields continued to fluctuate, placing pressure on risk assets, while the three major U.S. stock indexes opened with mixed performance. Against the backdrop of tighter macro liquidity, the crypto market experienced sharp deleveraging volatility over the past 24 hours, with most sectors moving lower. Bitcoin spot price has now fallen below the $62K level, down 1.50% over 24 hours to around $61,745.20. Ethereum also declined 1.65%, losing the key $1,700 psychological level during intraday trading and touching a local low of $1,682.15. As prices broke lower, the derivatives market saw a broad liquidation wave. Total liquidations across the market reached USD 406 million over the past 24 hours. Long liquidations dominated the move, reaching USD 306 million, while short liquidations stood at USD 99.8565 million. Bitcoin long and short liquidations reached USD 84.6771 million and USD 33.0381 million respectively. Ethereum long and short liquidations reached USD 62.3726 million and USD 22.7864 million respectively. In addition, 112,686 traders were liquidated across the market. The largest single liquidation order occurred on an ETH-USDT contract on a major CEX, with a value of USD 7.6637 million. On the spot side, outflows continued. Bitcoin spot ETFs recorded total net outflows of USD 77.4378 million yesterday, marking the third consecutive day of outflows. BlackRock’s IBIT saw the largest net outflow at USD 61.6422 million. Ethereum spot ETFs also recorded net outflows of USD 40.8513 million. Grayscale’s ETHE remained under pressure, with net outflows of USD 17.4201 million. Under the impact of multiple bearish factors, the Crypto Fear & Greed Index has dropped from last month’s neutral reading of 48 to 9 today, entering the Extreme Fear zone. This reflects strong concern among market participants over a short-term structural breakdown, while overall trading behavior has become more conservative.
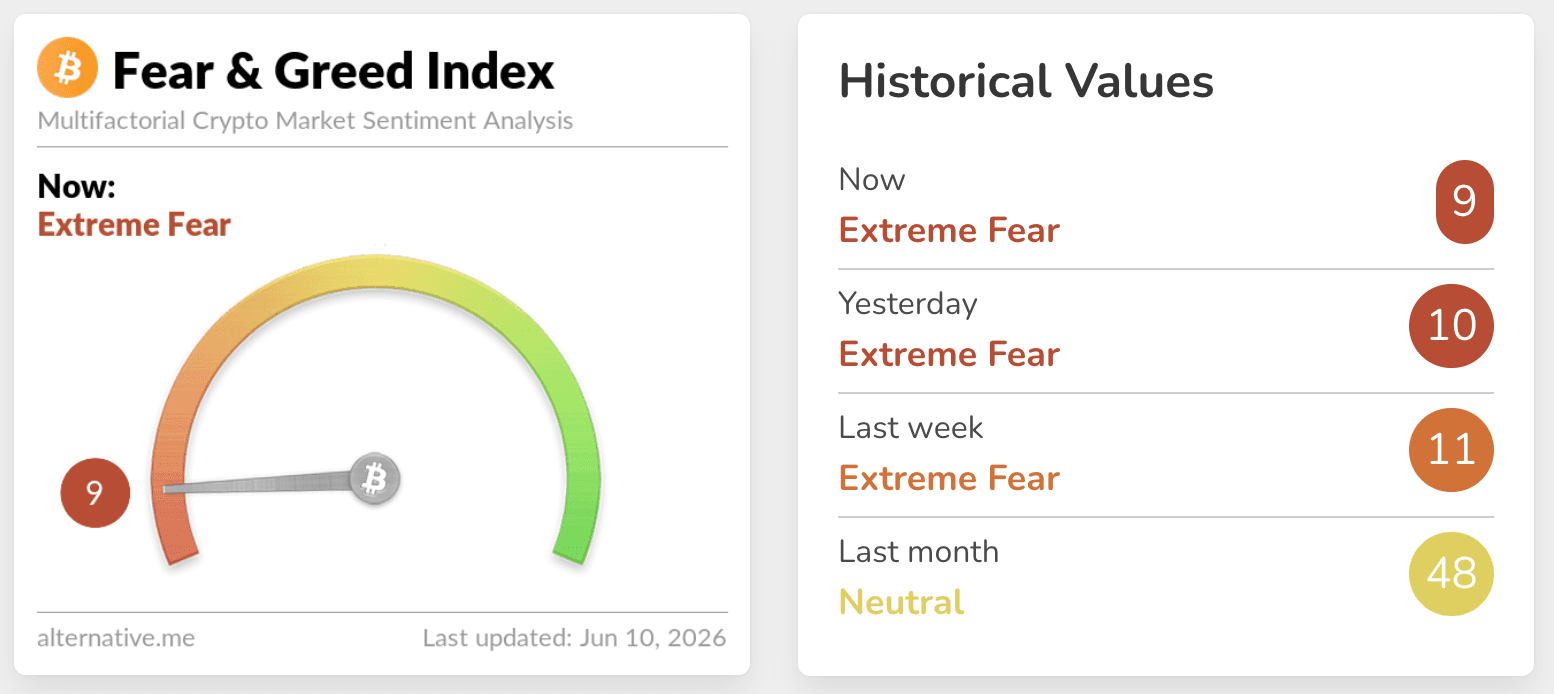
Source: Alternative
Key News Highlights:
Ethereum Derivatives Leverage Clears Sharply as Market Focus Turns to the $1,500 Key Structural Support
On-chain analysts noted that Ethereum futures open interest across trading platforms fell sharply by 25% during the recent sell-off, dropping from USD 16.6 billion in May to USD 12.6 billion. Open interest on some major trading platforms has even returned to levels last seen in April 2025. Data shows that Ethereum open interest on a major CEX fell 45% to USD 2.68 billion on June 9, down from USD 4.84 billion on May 7. This nearly erased the leveraged positions accumulated from late 2025 to early 2026. Another major derivatives platform saw its Ethereum open interest fall to around USD 805 million. In contrast, open interest on a major CEX remained relatively high at USD 2.76 billion, but its funding rate has turned negative at -0.0047. This indicates that short traders are paying a premium to maintain their positions. It also highlights the cautious sentiment and internal divergence within the market. At the same time, a large shift took place on the spot supply side. Ethereum exchange reserves across major platforms fell by a total of 480,000 ETH over the past few days. A continued decline in exchange reserves could theoretically reduce potential long-term selling pressure, but the current technical structure remains fragile. According to technical chart analysis from trader Ash Crypto, Ethereum has failed to hold several previous support levels. Market attention has now fully shifted to the $1,500 weekly structural support. If ETH closes the week above $1,500, it may preserve the defense of a historically important support zone. If that level breaks, market attention could move further toward the deeper support area near $1,000.
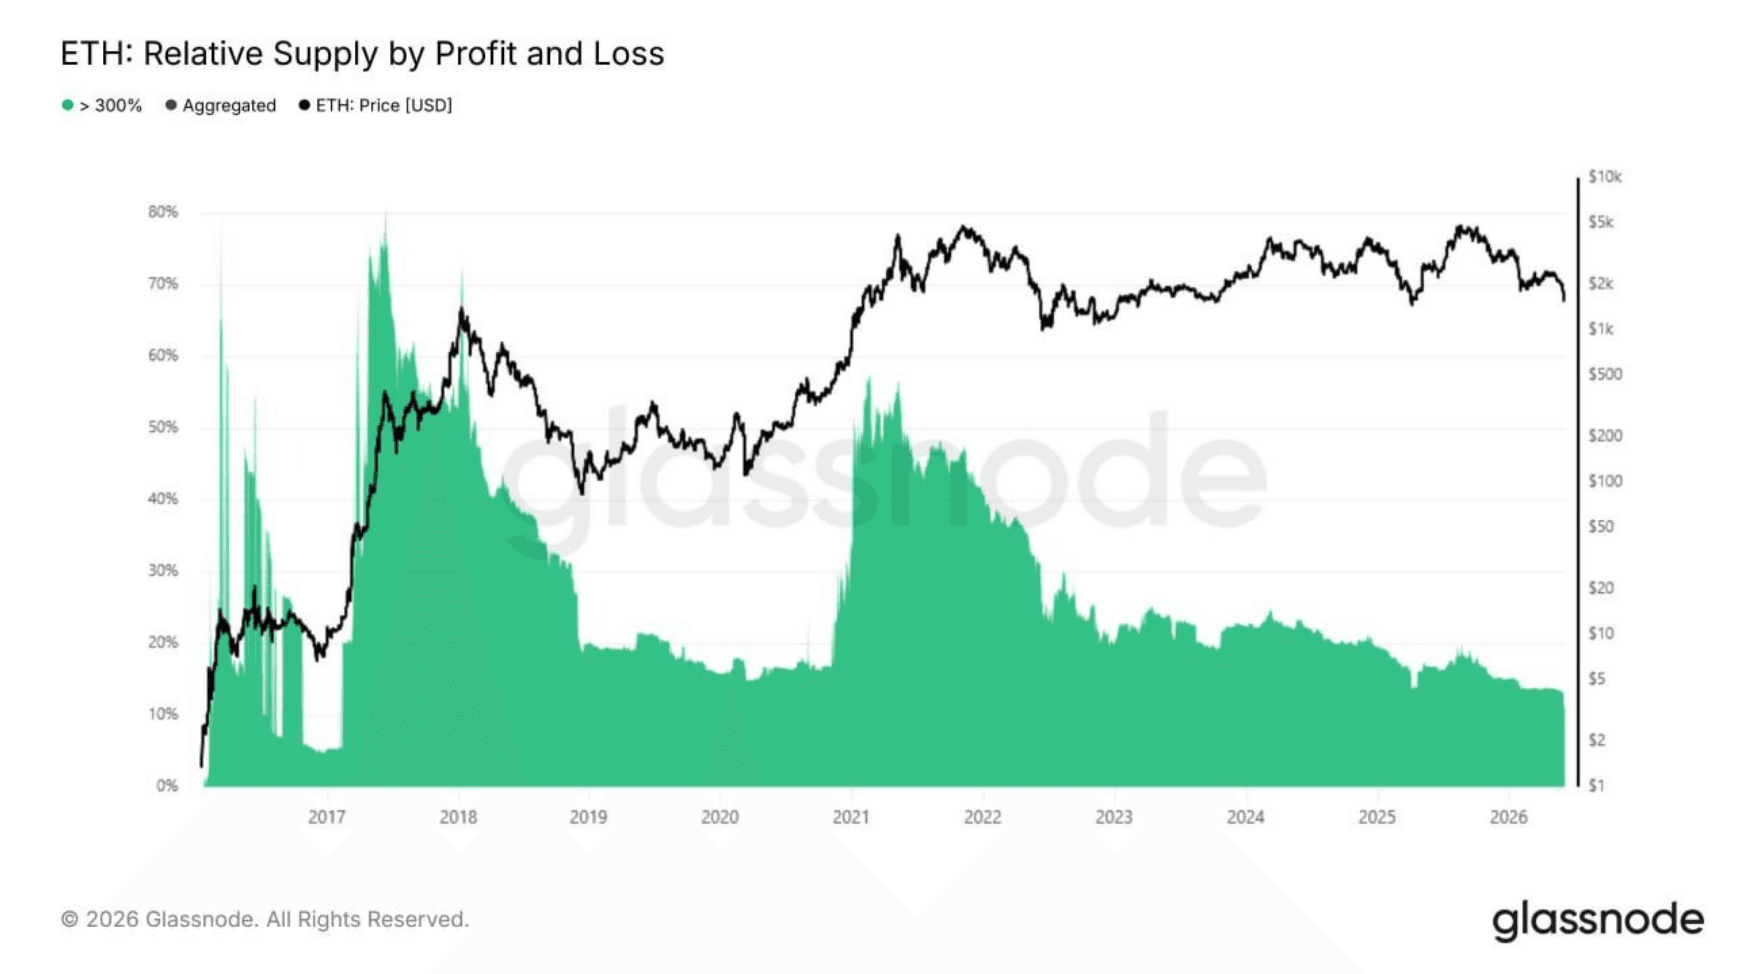
ETH: Relative Supply by Profit and Loss. Source: Glassnode
Prediction Markets See Explosive Growth as World Cup Sector Volume Surpasses USD 1.8 Billion
As the group stage of the 2026 FIFA World Cup officially begins, decentralized prediction market platform Polymarket has seen an unprecedented surge in activity. Its World Cup winner market has now surpassed USD 1.8 billion in cumulative trading volume. Over the past 24 hours, daily contract volume on the platform exceeded USD 66 million. Total liquidity across World Cup-related markets reached USD 352 million, making it the largest single sports event market on the platform since its launch in 2020. Based on the latest prediction data and implied probability analysis, France currently leads with an implied winning probability of 16.2%. Spain follows closely at 16.0%, placing both teams among the strongest co-favorites in the market. Portugal and England rank third and fourth with 11.3% and 10.9% respectively. Defending champion Argentina stands at 8.8%, while traditional powerhouse Brazil remains at 8.3%. Since France and Spain were drawn into the same group, their upcoming group-stage match carries significant price-discovery value for the prediction market. Data shows that the France winner market has attracted USD 40.9 million in volume, while the Spain winner market has recorded USD 33.6 million. These two markets rank at the top among all single-country winner markets. By comparison, although host nation the United States has an implied winning probability of only around 3%, its related markets have still generated USD 50.9 million in cumulative trading volume due to strong retail participation. Beyond the flagship winner market, Polymarket has also launched separate group winner markets for all 12 groups, with combined trading volume of around USD 3.4 million. The contract predicting which continent will win the World Cup has also recorded USD 3.3 million in volume, with Europe viewed as the clear favorite due to its concentration of top teams. The additional USD 342 million in volume over the past week and USD 881 million over the past month clearly show how prediction markets are expanding faster as the tournament progresses. The broader prediction market sector has also made notable progress in both regulatory and commercial development. Kalshi, a regulated event contract platform, recently launched sports prediction markets for U.S. users, expanding regulated access beyond political and economic contracts. This marks a further step toward bringing crypto prediction markets into mainstream finance and mass entertainment.
Bitcoin Tests Weekly Lows as Historical Cycle Patterns Suggest Bearish Pressure Remains Strong
Ahead of the U.S. stock market open and key macro inflation data, renewed sell-side pressure pushed Bitcoin to a local weekly low on Tuesday. BTC fell below $62,000 and had previously tested a macro low near $59,100. From a technical perspective, Bitcoin faced a double rejection near $64,200, then moved lower again. This put the market back under pressure to retest the $60,000 psychological support level. Well-known trading analyst Michaël van de Poppe said that bulls must break through and hold above $65,000 to regain control of the market. He emphasized that $65,000 was a key structural support level after the market crash in early February. It has now turned into a strong short-term resistance zone. Only a breakout above this area could open the path toward $72,000 to $74,000. He also suggested that the recent sell-off driven by irrational panic may not last for long. However, market analyst Rekt Capital offered a more cautious warning from a longer-cycle perspective. His monthly chart analysis shows that current Bitcoin price action has strong similarities with the paths that led to historical cycle lows in previous bear markets. Specifically, Bitcoin has now lost both its 50-month exponential moving average and the lower support of a long-term triangle structure. These structural breakdown features closely resemble the bearish acceleration phases seen in 2018 and 2022. He warned that if Bitcoin fully confirms a breakdown from this triangle structure at the next monthly close, the market could face further bearish acceleration to the downside. On the macro side, Bitcoin recently diverged noticeably from U.S. equities. While the S&P 500 and Nasdaq opened higher, the crypto market continued to move lower. At the same time, geopolitical and commodity markets saw new volatility. As expectations for progress in U.S.-Iran peace talks resurfaced, WTI crude oil futures fell below $88 per barrel, marking their lowest level since May 29. This shift in macro capital allocation is also indirectly affecting marginal liquidity in the crypto market.
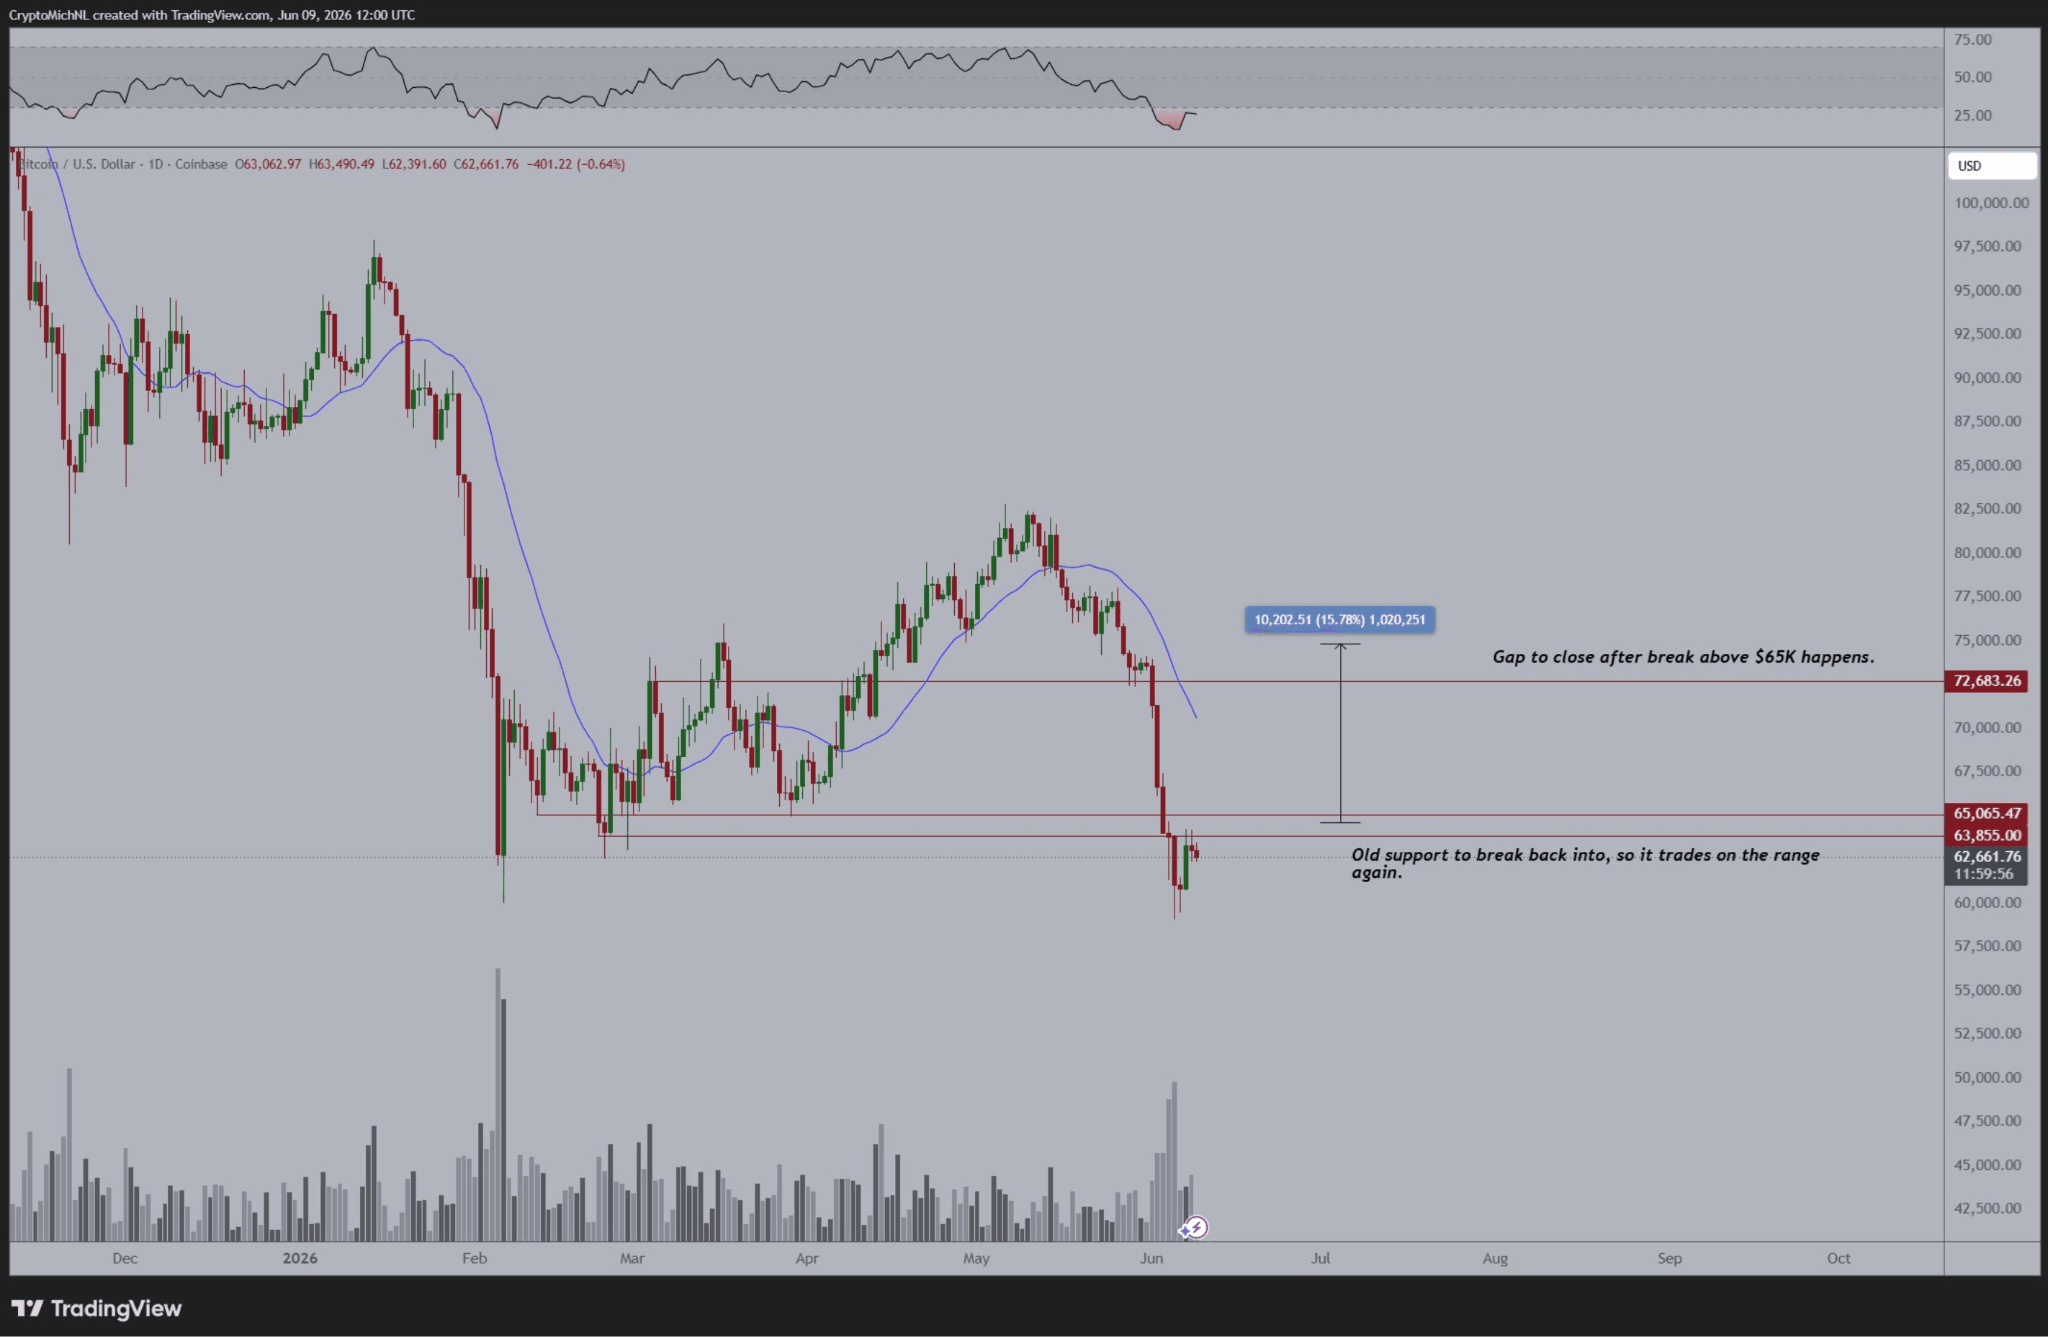
BTC/USD One-Day Chart. Source: Michaël van de Poppe/X
MiCA Architect Urges EU to Prioritize RWA Tokenization Over Decentralized Finance Regulation
As the transitional period for the EU’s Markets in Crypto-Assets Regulation is set to officially end on July 1, the European Commission is actively gathering public feedback on the future development of the regulatory framework. However, Peter Kerstens, one of the key architects of MiCA and an adviser to the European Commission, stated clearly during a fireside chat at the WAIB Summit Monaco that the EU’s future legislative focus should be on building a broader digital asset framework. In his view, this framework should prioritize real-world assets and tokenization, rather than rushing to regulate decentralized finance through a second version of MiCA. The European Commission launched a public consultation on MiCA in May, with the feedback period running until August 31. Although decentralized finance protocols and other emerging risk areas have been included in the review scope, Kerstens said the current MiCA framework is not outdated. He further explained that directly regulating DeFi presents major legal challenges. Existing laws and regulations are designed to apply to individuals and specific organizational structures. They cannot easily apply to a piece of code running on a computer network, or to a non-entity protocol.
Disclaimer: The information provided in this section is for informational purposes only and doesn't represent any investment advice or FameEX's official view.