What's Behind Today's Drop in Bitcoin's Price?
2024-02-22 10:32:15Today, Bitcoin is experiencing a decline in its price. However, it remains uncertain whether this selling pressure marks the beginning of a more pronounced trend reversal.
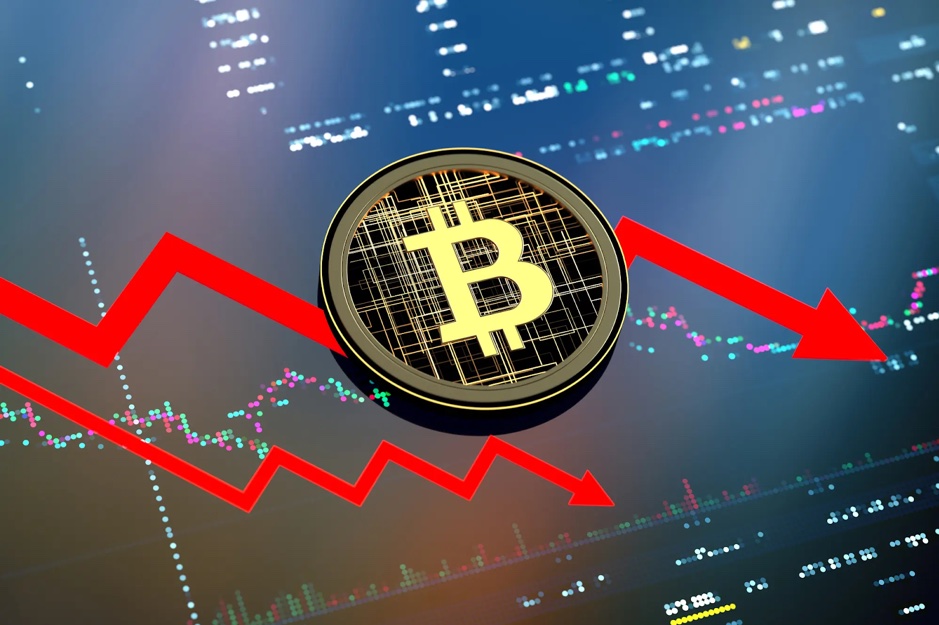
Source: nypost.com
Today, the cryptocurrency market is witnessing a decline, with the total market capitalization dropping by 2.75% to reach $1.90 trillion on February 21. This downturn has led to a 0.25% increase in Bitcoin's market dominance, now standing at 50.77%. Technical indicators point to potential deeper corrections. The decrease in Bitcoin's price can be attributed to various factors. Google Trends data indicates a lack of interest from retail investors, despite Bitcoin's impressive 109% surge in the past 12 months.
This suggests lingering skepticism among retail participants. Coinbase's recent earnings report aligns with this observation, revealing low retail activity in the last quarter of 2023. Examining the data further shows that retail engagement from Q2 2022 to Q4 2023 remained below the stats recorded in Q4 2020, underscoring the delayed arrival of retail investors. Retail transactions, once contributing over 90% of the company's revenues, now only account for slightly less than half of the firm's net revenue. Additional insights from market intelligence firm Santiment support this narrative, stating that while there was interest in Bitcoin in the weeks surrounding the SEC's approval of 11 ETFs, there is a noticeable absence of "new greed" in the market.
The RSI of Bitcoin Displays a Bearish Divergence
Since January 22, Bitcoin's price has been on the rise after the initial impact of the "sell-the-news" reaction to the approval of the spot Bitcoin ETF began to fade. The slowdown in GBTC outflows, coupled with increased inflows into other spot ETFs, contributed to this upward trend. The momentum accelerated in February, propelling Bitcoin to a two-year high of $53,019 on February 20. However, concerns arose as the price swiftly declined from this peak.
Analyzing the BTC/USD 4-hour chart reveals a bearish divergence in the four-hour RSI (blue trend line) preceding the decline. The Relative Strength Index (RSI) is a momentum indicator used to gauge whether a market is overbought, oversold, or in accumulation. A bearish divergence in the RSI occurs when the price increases alongside a decrease in momentum, signaling potential downward movements. This bearish divergence suggests that bears might be taking control of the market, with potential plans to bring the price down towards the 100-day Exponential Moving Average (EMA) at $49,234 in the short term.
Disclaimer: FameEX makes no representations on the accuracy or suitability of any official statements made by the exchange regarding the data in this area or any related financial advice.