As the BTC Price Remains Above $51,000, AI-Related Tokens, Including FIL and GRT, Show Positive Momentum
2024-02-26 09:58:55Bitcoin's price has initiated a gradual recovery, providing a boost to the bullish sentiment in FIL and GRT.

Source: news.bitcoin.com
Following a robust performance over the past two weeks, Bitcoin is now pausing around the $52,000 mark. Despite attempts by bears to initiate a correction, the bulls remain resilient. Factors such as strong equity markets, the upcoming halving, and substantial inflows into spot Bitcoin exchange-traded funds are expected to mitigate any potential downturns. Analysts are closely monitoring the inflows into these ETFs to gauge Bitcoin's next directional move. Recent research data indicates that Grayscale Bitcoin Trust outflows were merely $44 million on Feb. 24, marking the lowest figure since Jan. 11.
Crypto sentiment remains positive as Bitcoin maintains its position above $50,000. While Bitcoin consolidates, short-term traders may explore trading opportunities in altcoins exhibiting strength. The question arises: will Bitcoin resume its upward trajectory after this brief pause? And will altcoins follow suit? Let's examine the top cryptocurrencies showing resilience on the charts.
Analysis of Bitcoin Price Action
Bitcoin has been consolidating within a narrow range, with support around $50,500 and resistance near $53,000. This indicates a positive sentiment, suggesting that the bulls are not rushing to exit their positions. The upward trend of moving averages and the relative strength index (RSI) hovering near the overbought territory suggest that the bulls are in control. A breakthrough above $53,000 could pave the way for a rally toward $60,000.
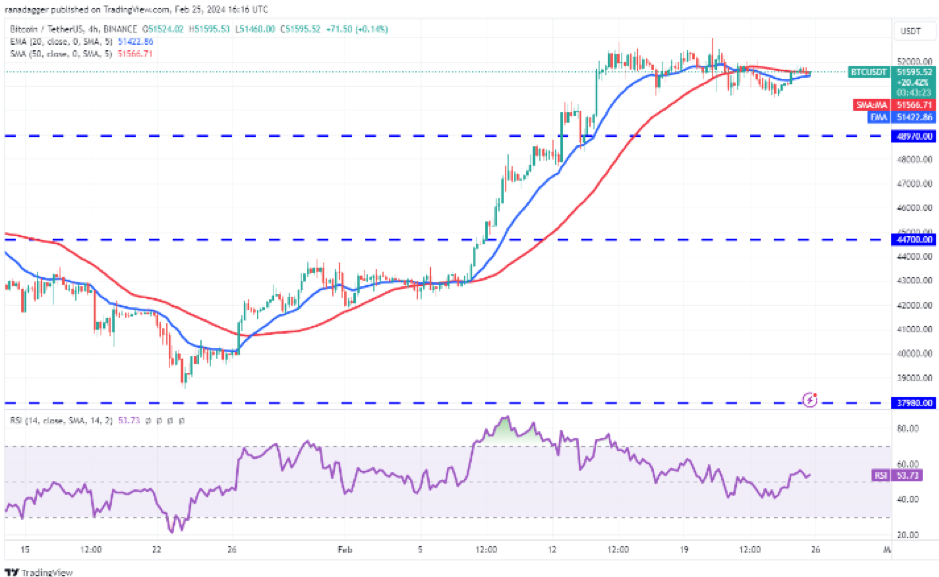
BTC/USDT 4-hour chart. Source: TradingView
Time is ticking for the bears, who need to act swiftly to prevent a rally. Breaking the price below the breakout level of $48,970 could lead the BTC/USDT pair to dip toward the 50-day simple moving average at $45,542. On the 4-hour chart, the moving averages are relatively flat, and the RSI is slightly above the midpoint, indicating a minor advantage for the bulls. Maintaining a position above the 50-SMA could propel the pair towards $53,000. Although this level may pose strong resistance, surpassing it could trigger a rally toward $55,000 and eventually $60,000. Conversely, if the price retraces from $53,000, the pair may continue to consolidate within the range. A drop below $50,500 could push the pair towards $48,970, a crucial short-term support level. A breach below this level would shift the advantage towards the bears.
Analysis of the AI-Concept Token, Filecoin in Price Action
In recent days, the bulls have struggled to propel Filecoin above the resistance level of $8.12, but they have remained persistent in their efforts. On February 25, the bulls are once again attempting to breach the overhead zone spanning from $8.12 to $8.57. A successful breakthrough would signify the continuation of the uptrend, potentially leading the FIL/USDT pair toward the $10 resistance level, where strong resistance from bears is anticipated.
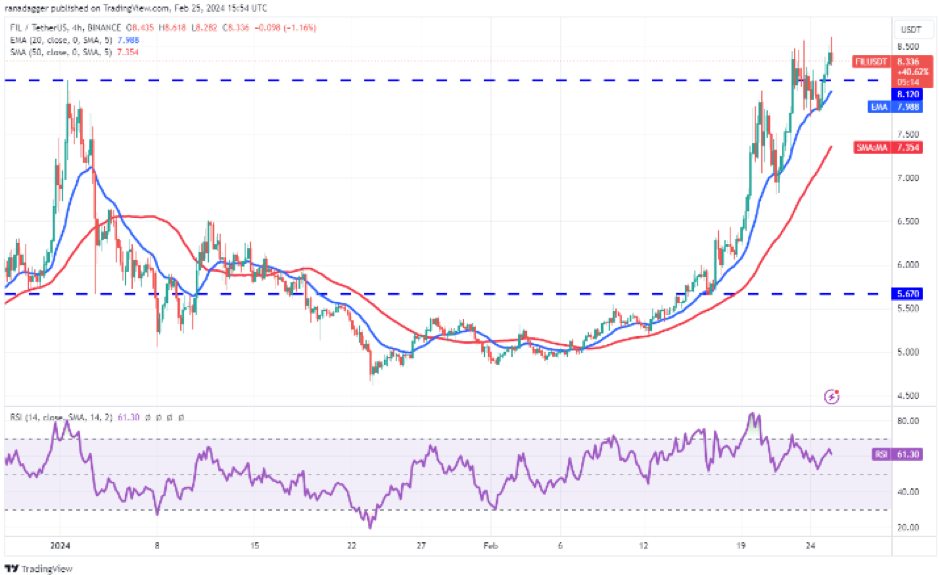
Source: FIL/USDT 4-hour chart. Source: TradingView
However, a reversal of this scenario, marked by a decline below $7.70, would indicate robust defense by the bears in the overhead zone. Such a development may trigger a descent toward the 20-day Exponential Moving Average (EMA) at $6.74, which is anticipated to offer significant support. The pair's rebound from the 20-EMA suggests that market sentiment remains positive, with traders viewing dips as buying opportunities. Sustaining the price above the resistance barrier at $8.57 could propel the pair towards $9.
While the upward trajectory of moving averages favors the bulls, the Relative Strength Index (RSI) is displaying signs of a potential negative divergence, signaling a weakening bullish momentum. For sellers to gain control, they would need to push and maintain the price below the 20-EMA, indicating a potential correction towards the 50-period Simple Moving Average (SMA).
Analysis of AI Token The Graph Price Action
On February 18, The Graph breached the overhead resistance at $0.23, signaling a resurgence of the uptrend. Despite attempts by bears to halt the upward movement around $0.30, bulls have successfully prevented the price from slipping below the breakout level of $0.23, indicating a propensity for buying during dips.
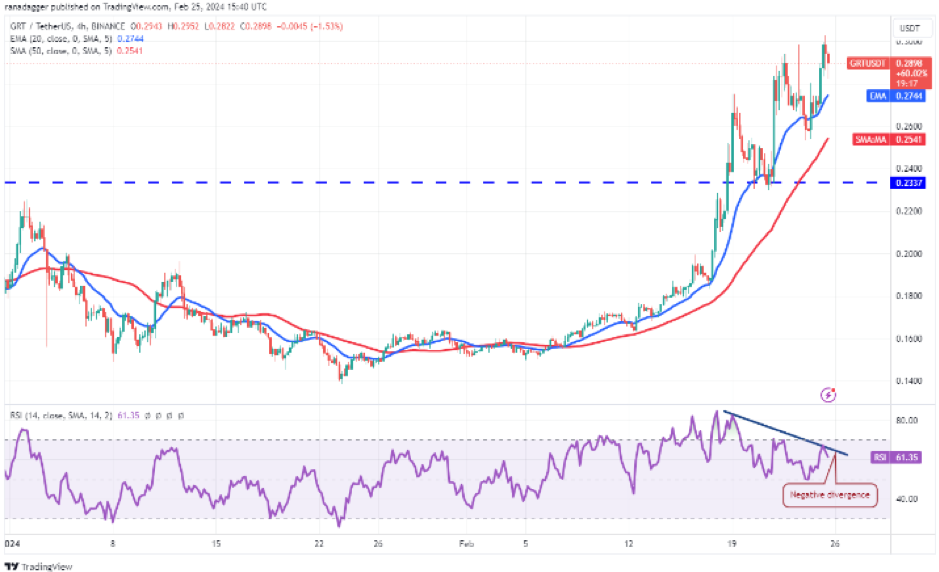
GRT/USDT 4-hour chart. Source: TradingView
Should the price remain above $0.30, the GRT/USDT pair could surge towards $0.37. However, potential downside risk arises from the overbought status of the Relative Strength Index (RSI), suggesting a potential correction or consolidation in the near future. A shift in trend favoring bears could occur if the price falls below the 20-day Exponential Moving Average (EMA) at $0.22.
The 4-hour chart indicates that the pair is finding support at the 20-EMA during declines, which is a positive indication. However, the RSI's negative divergence implies a weakening positive momentum. Should the price continue downward and breach the 20-EMA, selling pressure may intensify, potentially leading to a decline towards $0.23. Conversely, a rebound from the current level or the 20-EMA would confirm the continuation of the uptrend. In such a scenario, bulls will aim to overcome the barrier at $0.30, initiating the next phase of the uptrend.
Disclaimer: FameEX makes no representations on the accuracy or suitability of any official statements made by the exchange regarding the data in this area or any related financial advice.